Portfolio exposure can be anywhere from 0% to 60% long (or more), depending on how open positions have held up the past three days.
Past signals:
- Buy signal generated on close of November 13
- Buy signal generated on close of September 9
- Neutral signal generated on close of August 15
- Buy signal generated on close of July 11
- Neutral signal generated on close of July 5
- Sell signal generated on close of June 24
today’s watchlist (potential trade entries):

Having trouble seeing the open positions graphic above? Click here to view it directly on your web browser instead.
open positions:Below is an overview of all open positions, as well as a report on all positions that were closed only since the previous day’s newsletter. Changes to open positions since the previous report are listed in pink shaded cells below. Be sure to read the Wagner Daily subscriber guide for important, automatic rules on trade entries and exits.

Having trouble seeing the open positions graphic above? Click here to view it directly on your web browser instead.
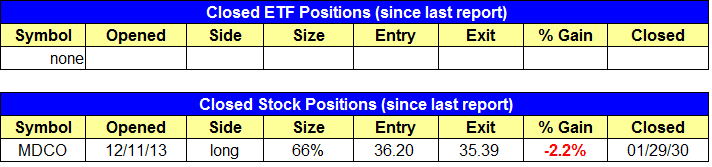
closed positions:
Having trouble seeing the closed positions graphic above? Click here to view it directly on your web browser instead.
ETF position notes:
- No trades were made.
stock position notes:
- Sold $MDCO for a small loss (raised stop from original level). $BOSC buy stop triggered but lacked any follow through. Note the tight stop in the open positions section.
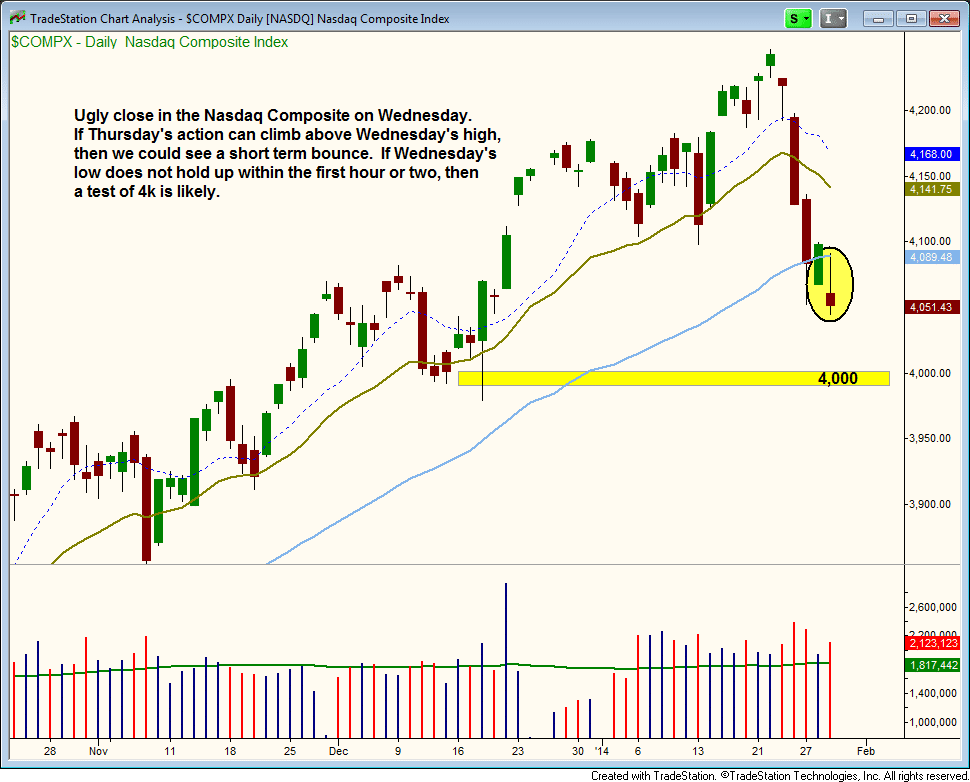
ETF, stock, and broad market commentary:Wednesday’s heavy volume selling action produced yet another distribution day in the S&P 500 and Nasdaq Composite. With the Nasaq at 7 distribution days, the volume pattern portion of the timing model is at a clear sell signal. With all broad based moving averages below the 50-day MA, the trend component of the timing model is at a sell as well, although we would like to give it to the end of the week to see if the Nasdaq can bounce back. The leadership portion of the model is preventing us from issuing a full sell signal right now, but it isn’t holding on by much.
Although we are not at a full sell signal, we have been laying low in neutral this week. The long side is all about low volatility and steady/reliable price action. Current conditions are quite volatile. So, even if we were to spot bullish setups on the long side like an $AMBA or $AL, the market is simply too unstable to add new exposure with confidence.
The Nasdaq reversed off the 50-day MA and closed near the lows of the session, around Tuesday’s low. If the action follows through to the downside on Thursday, then we could see short-term momentum take the index down to 4,000. However, a false move lower in the first hour of trading and a rally above Thursday’s high could lead to a short-term bounce.
Obviously, there are quite a few scenarios that could play out, and that is why we shy away from predicting market action or spending too much time worrying about where the averages will go. Profitable trading is all about reacting to price action, not predicting it. We can discuss different possibilities and have a plan in place, but we have no clue what will happen tomorrow.
 Emerging markets have taken a beating over the past few months and could potentially offer some decent short setups down the road. The monthly chart below of the inverted ProShares Short MSCI Emerging Markets ETF ($EUM) shows the big volume breakout above the 10-month moving average, which is close to a 200-day moving average.
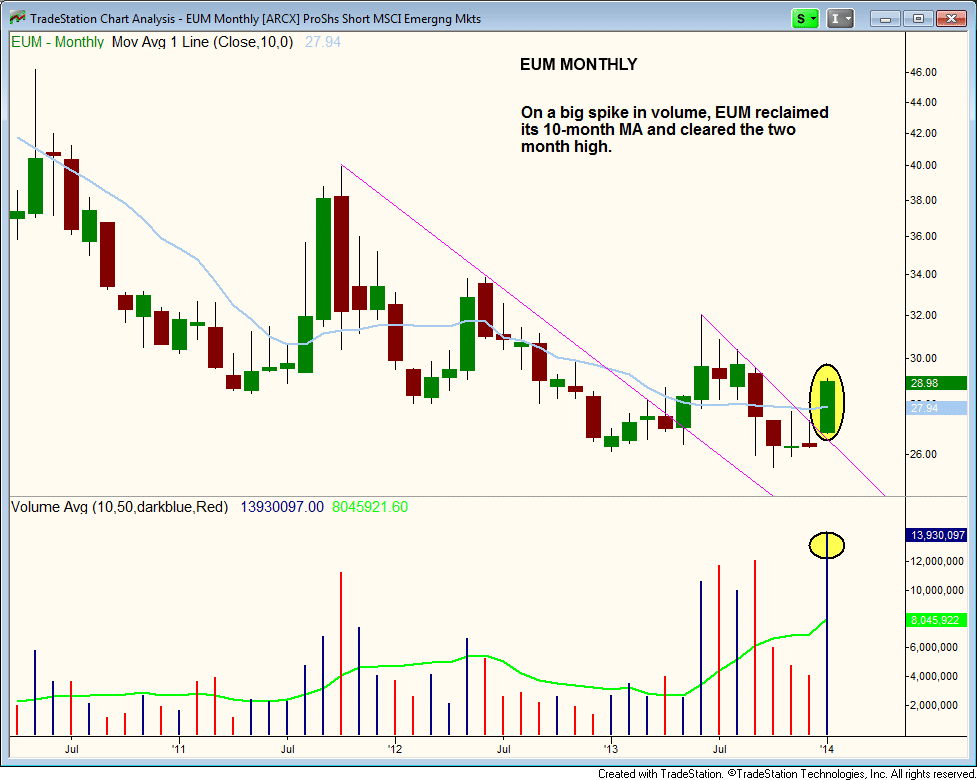 The spike in volume this month was the biggest in several years. Also of note is that the price action has held support at $26 despite a ton of volume hitting the ETF in the second half of 2013. Big volume at the lows with the price refusing to sell off is a bullish sign.
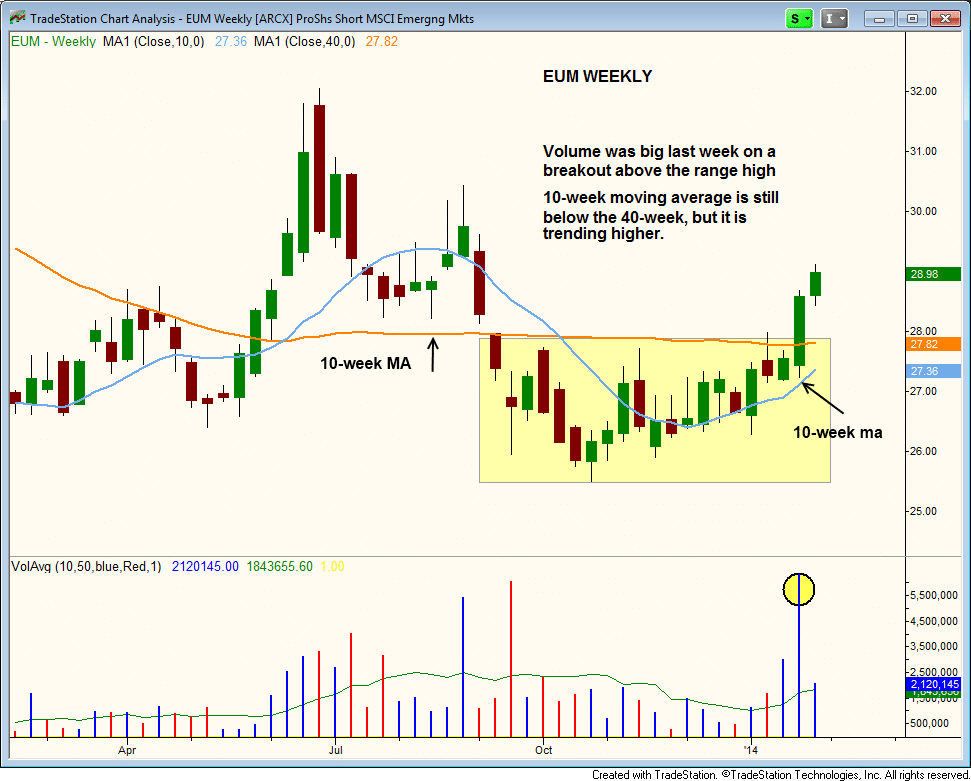
On the weekly chart, we see the breakout above the 40-week MA, while the price action has held above the rising 10-week MA for the past two months. The 10-week MA is still below the 40-week MA, but could soon break above which would confirm that a trend reversal is in place.
 With the market already down sharply, there are simply no low risk short entries around. Chasing on the short side can be just as bad or worse than chasing longs, as those who have been caught in a short squeeze know that the price action can explode higher for several days before taking a break.
On the stock side we have tightened up stops in a few winning trades. Note that we have tight stops in $SYNA and $SCTY to bring each position down to 50%. We also raised the stop in $FB to $57.99 based on the $60 close in after hours trading. If $FB opens below $57.99, then it is a sell on the open. If it opens at $60 and runs higher, then we will continue to stick with the position and potentially trail the stop.
Since conditions have quickly deteriorated, we do not feel comfortable holding anything other than a few positions that are showing incredible relative strength. However, if these leading stocks begin to break down we will cut back exposure as needed.
The idea with $SYNA and $TSLA is that we could get lucky and potentially have these positions set higher swing lows while the market is in pullback mode. It is a possibility and would be nice, but nothing is guaranteed. If you feel uncomfortable holding these positions while the market gets hit, then we suggest you either back the size down a bit more or take profits on the full position.