Buy – Signal generated on the close of April 30 (click here for more details)
today’s watchlist (potential trade entries):

Having trouble seeing the open positions graphic above? Click here to view it directly on your web browser instead.
open positions:
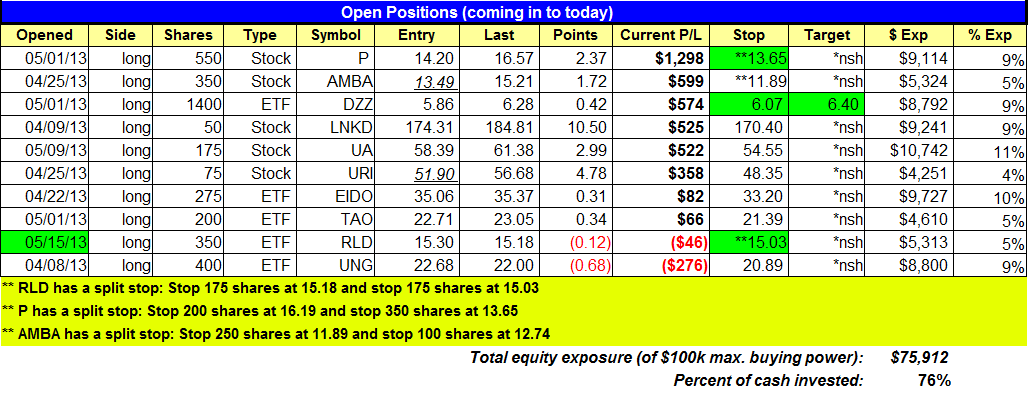
Below is an overview of all open positions, as well as a report on all positions that were closed only since the previous day’s newsletter. Net P/L figures are based a $100,000 model portfolio. Changes to open positions since the previous report are listed in pink shaded cells below. Be sure to read the Wagner Daily subscriber guide for important, automatic rules on trade entries and exits.
Having trouble seeing the open positions graphic above? Click here to view it directly on your web browser instead.
closed positions:

Having trouble seeing the closed positions graphic above? Click here to view it directly on your web browser instead.
ETF position notes:
- Note the new stop and target price in $DZZ.
stock position notes:
- Note the new split stops in $RLD and $P.
ETF, stock, and broad market commentary:
Stocks rallied once again on higher volume, closing with modest gains across the board. The Nasdaq continues to push higher with impressive gains in $GOOG and $PCLN. $APPL pulled back to a strong support level on heavy volume, and could potentially be forming an inverted head and shoulders pattern on the daily chart IF it can hold the 415-420 level the next few weeks.
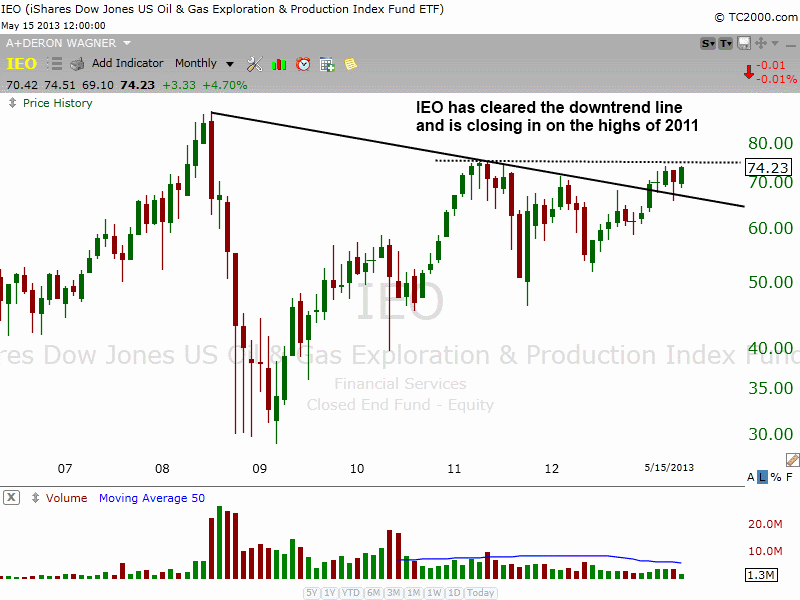
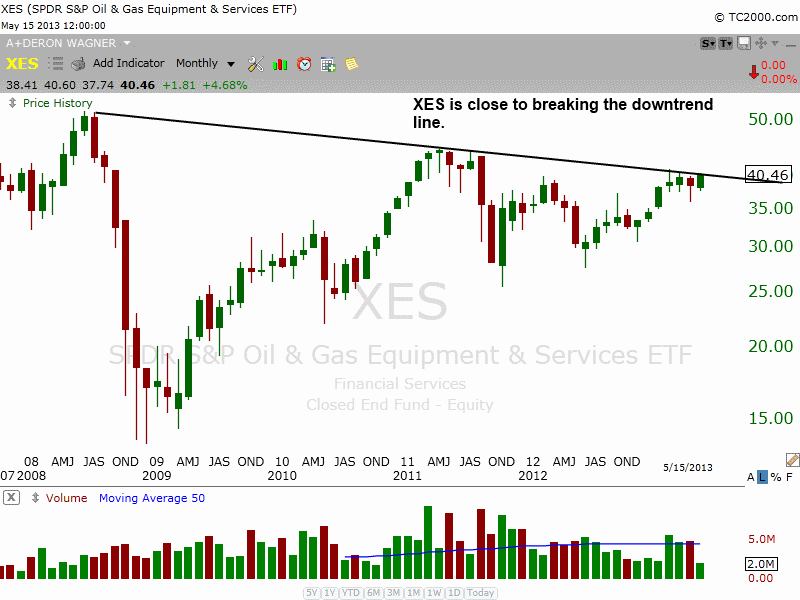
Along with the market, most ETFs are a bit extended in our scans and may need some time to rest. Although the setups have dried up this past week, we did notice some bullish patterns developing on the monthly chart of energy ETFs $IEO and $XES.
iShares Dow Jones US Oil & Gas Exploration ETF ($IEO) cleared the monthly downtrend line in January and has since consolidated in a fairly tight range. If $IEO can clear $75, then the next stop will be the prior highs of 2008, around $86.
SPDR S&P Oil & Gas Equipment & Services ETF ($XES) has a similar look to $IEO, but the price action has yet to break the monthly downtrend line. $XES is also consolidating in a tight range the past few months, but has relative pattern weakness to $IEO, as it is further away from the highs of 2008 and 2011.
Claymore/AlphaShares China Real Estate ETF ($TAO) is in pullback mode on the daily chart, retreating to the 20-day EMA. Rather than adding to our position here, we’d like to see a tight, two to three week consolidation form above the 10-week MA (teal line) on the weekly chart below.
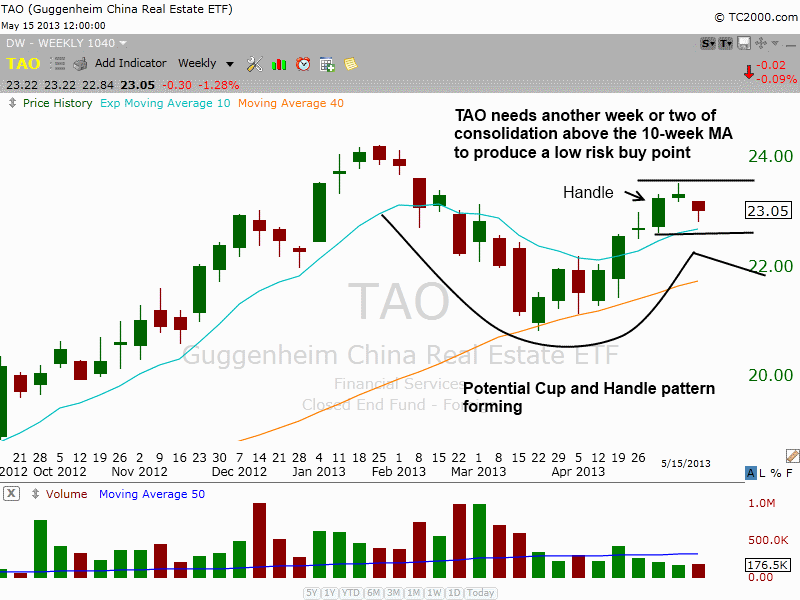
$TAO is forming a cup and handle type pattern on the weekly chart after finding support at the 40-week MA (same as 200-day MA on daily chart). We could see a low risk entry point to add to our existing position in $TAO if the price action can form a higher swing low within the handle.
With $GLD selling off, our position in $DZZ is in good shape and we plan to sell into strength on a test of the prior swing high (see new target and stop price in the open positions section above).
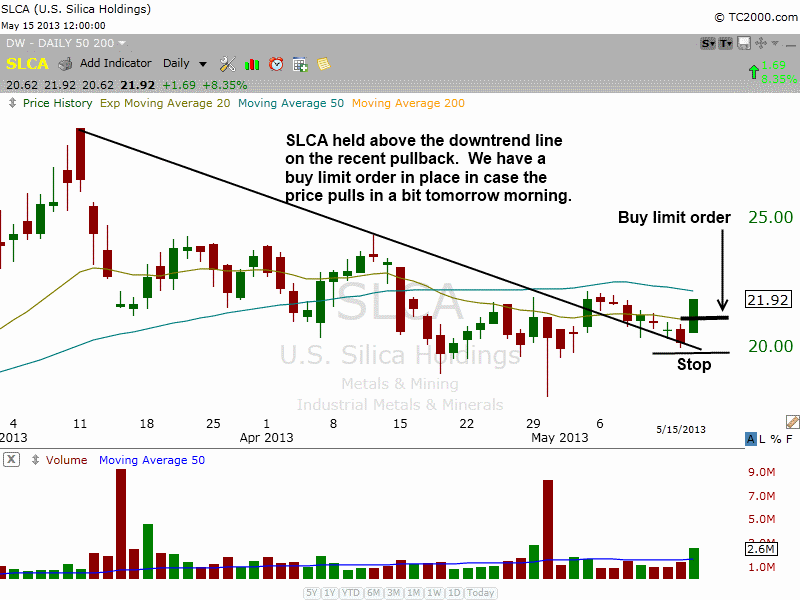
We have one new setup on today’s watchlist in $SLCA. We are looking for a slight pullback in $SLCA, so we are using a buy limit order, which will allow us to purchase $SLCA if it pulls back to our trigger price. Remember, this is an entry on weakness, not on strength. We will enter only if the price action pulls back to our price. If our trigger is hit and your position is not filled, please enter the trade with a market order as soon as you can.
The technical setup is pretty simple. $SLCA has formed a constructive base just below the 50-day MA, and recently broke above the downtrend line and held support of the downtrend line during a short-term pullback. With $SLCA back above the 20-day EMA on a pick up in volume, we are looking for the price action to reclaim the 50-day MA late this week or early next week.
Please note that we have two new split stops in place. We raised the stop on 200 shares of our positon in $P to lock in a $400 gain. We plan to let the remaining 350 shares run to the $19-20 target as long as the price and volume action remains bullish.
The second split stop is in $RLD, which failed to follow through yesterday after a decent start. This is not an “A rated” stock for us, so we have very little patience when the price action does not go as expected. We have a stop in for half the position below yesterday afternoon’s swing low, and the other half is below yesterday’s low. If both stops hit it should only result in a small scratch loss.
relative strength combo watchlist:
Our Relative Strength Combo Watchlist makes it easy for subscribers to import data into their own scanning software, such as Tradestation, Interactive Brokers, and TC2000. This list is comprised of the strongest stocks (technically and fundamentally) in the market over the past six to 12 months. The scan is updated every Sunday, and this week’s RS Combo Watchlist can be downloaded by logging in to the Members Area of our web site.