market timing model:
Confirmed Buy – Signal generated on the close of September 4 (click here for more details) (we are on a buy signal from the close of Aug. 16)
today’s watchlist (potential trade entries):

Having trouble seeing the open positions graphic above? Click here to view it directly on your web browser instead.
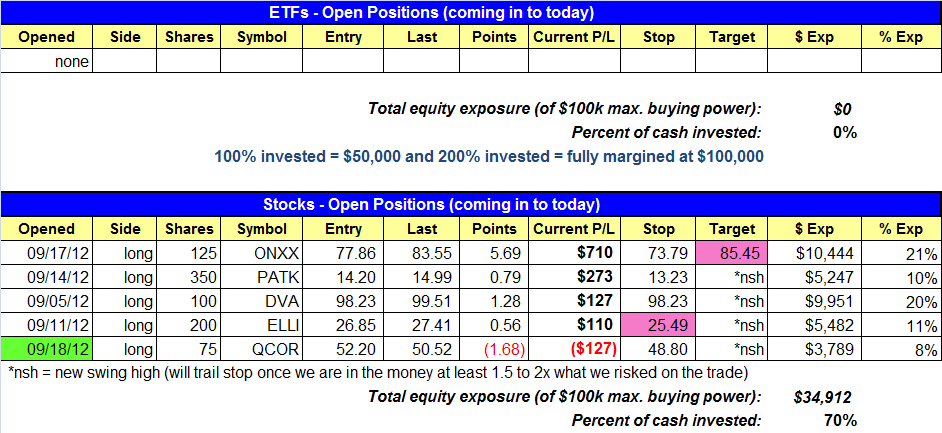
open positions:
Below is an overview of all open positions, as well as a report on all positions that were closed only since the previous day’s newsletter. Net P/L figures are based on two separate $50,000 model portfolios (one for ETFs and one for stocks). Changes to open positions since the previous report are listed in pink shaded cells below. Be sure to read the Wagner Daily subscriber guide for important, automatic rules on trade entries and exits.
Having trouble seeing the open positions graphic above? Click here to view it directly on your web browser instead.
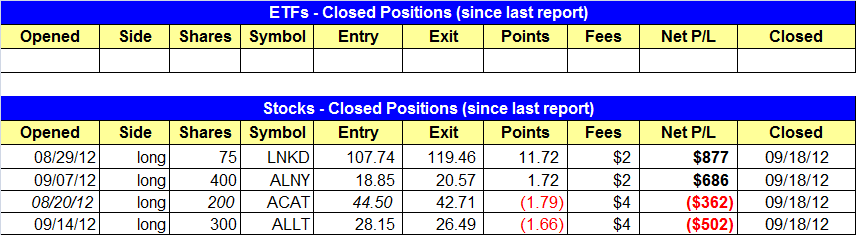
closed positions:
Having trouble seeing the closed positions graphic above? Click here to view it directly on your web browser instead.
ETF position notes:
- On both pullback entries the plan is to raise the stop on partial shares immediately ater the trade starts to move higher.
stock position notes:
- Locked in solid gains in LNKD and ALNY.
- ALLT and ACAT both hit our protective stops and we are out.
- QCOR buy setup triggered but failed to follow through in the afternoon. We removed the KORS buy setup for now but we will continue to monitor the action.
ETF and broad market commentary:
Like the previous day, the major indices oscillated in a tight, sideways range throughout the entire session. This time, stocks closed with mixed results, but near the flatline. The Dow Jones Industrial Average ($DJIA) eked out a gain of 0.1%, while the benchmark S&P 500 Index ($SPX) was lower by the same percentage. The Nasdaq Composite ($COMPQ) was unchanged. The small-cap Russell 2000 Index ($RUT) slipped 0.2% and the S&P Midcap 400 Index lost 0.6%. Although small and mid-cap stocks showed slight relative weakness for a second straight day, it was proportionate to the larger gains the indexes achieved during last week’s breakout.
Total volume in the NYSE was 2% higher than the previous day’s level. Turnover in the Nasdaq rose 15%. Since the decline in the S&P 500 was so small, and the volume increase was equally insignificant, we would not label yesterday as a bearish “distribution day.” Further, yesterday’s turnover levels were being compared to Monday’s slow pace of trade that was at least partially due to the Rosh Hashana Jewish holiday. In the NYSE, declining volume exceeded advancing volume by a ratio of 2 to 1. Like the closing price of the index, the Nasdaq ADV/DEC volume ratio was in parity.
Going into today’s session, we have added Alerion MLP ETF ($AMLP) to our official watchlist for potential trade entry. Below is a the daily chart of this ETF, which is tied to the energy infrastructure sector:

On the chart above, notice the clearly defined price resistance at the $16.60 level. A rally above the tight consolidation of the past several days would correspond to a breakout above this level, which would trigger our buy entry (see trade details in the ETF Watchlist section above). Our initial stop is just below the low of the breakout day from September 14, but we plan to raise the stop, at least on partial share size, as soon as this trade triggers for buy entry and starts moving higher. Now, take a look at the longer-term weekly chart pattern of AMLP as well:

With individual stocks in healthy markets, we primarily focus on buying breakouts of consolidation in stocks trading near their highs and buying short-term pullbacks to technical levels of price support. However, because ETFs are a slightly different animal, we sometimes trade trend reversals of ETFs breaking out of intermediate to long-term downtrends, which is the result of institutional sector rotation. Once we spot a longer-term trend reversal that meets our criteria (the ETF is not trading at absolute lows, moving averages have started turning higher, etc.), we then look for a low-risk, buyable pattern on the daily chart. We have both of these factors in place with AMLP.
We have been noticing a lot of trend reversals and sudden relative strength in select international ETFs, particularly among a few different Emerging Markets ETFs. As such, we have added iShares Emerging Markets Index ($EEM) to our ETF Watchlist for today (along with AMLP). In tomorrow’s Wagner Daily newsletter, we will analyze the technical chart pattern of this trade setup, and also highlight a few other international ETFs with potentially buyable chart patterns in the short-term. One benefit of international ETFs is that they have a slightly lower correlation to the direction of the stock market than standard industry sector ETFs that are tied to the performance of the US stock portfolios that comprise them.
stock commentary:
Our swing trading strategy focuses on identifying explosive breakouts in small and mid-cap stocks. These stocks typically run 10% to 20% higher in one to four weeks. In order to achieve these type of gains the stocks we trade are high beta with plenty of volatility. By identifying low risk entry points we are able to use the volatility to our advantage, as we look for stocks that have a volatility contraction and are due for a range expansion within a few days. Because of this, when these stocks do not move in our favor and break down it is extremely important to have stops in place. A good example of this is ACAT and ALLT today. Both setups did not go as planned and triggered our stop. Notice that ACAT sold off another 4% after hitting our stop. ALLT which is not shown here tanked another 7% from our exit. The bottom line is we must always maintain stop discipline when executing our system. What this means simply is that we can not hesitate to sell when a stop is triggered.

ELLI recovered nicely off the 26.00 support level after wiping out a lot of break-even stops. We raised our stop in the position and no longer have a split stop. We have a few new positions on the watchlist and removed KORS for now. So far, so good, the market continues to act well and new setups are emerging.
If you are a new subscriber, please e-mail [email protected] with any questions regarding our trading strategy, money management, or how to make the most out of this report.
relative strength combo watchlist:
Our Relative Strength Combo Watchlist makes it easy for subscribers to import data into their own scanning software, such as Tradestation, Interactive Brokers, and TC2000. This list is comprised of the strongest stocks (technically and fundamentally) in the market over the past six to 12 months. The scan is updated every Sunday, and this week’s RS Combo Watchlist can be downloaded by logging in to the Members Area of our web site.