Buy Mode
– Timing model generated buy signal on close of March 5 (click here for more details)
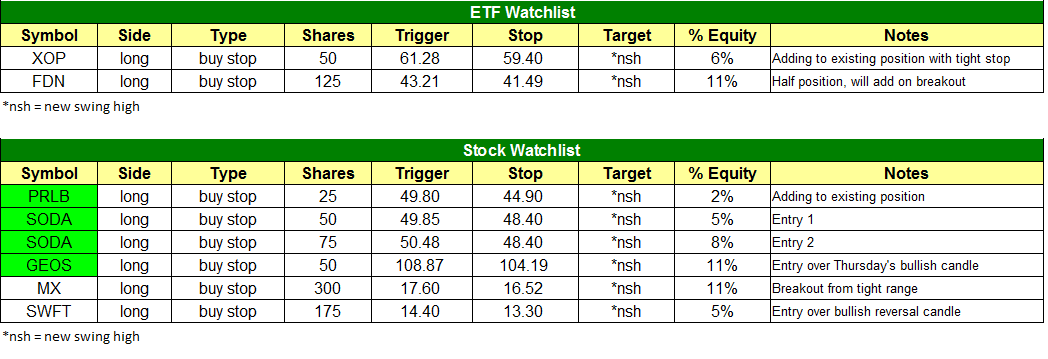
today’s watchlist (potential trade entries):

Having trouble seeing the open positions graphic above? Click here to view it directly on your web browser instead.
open positions:
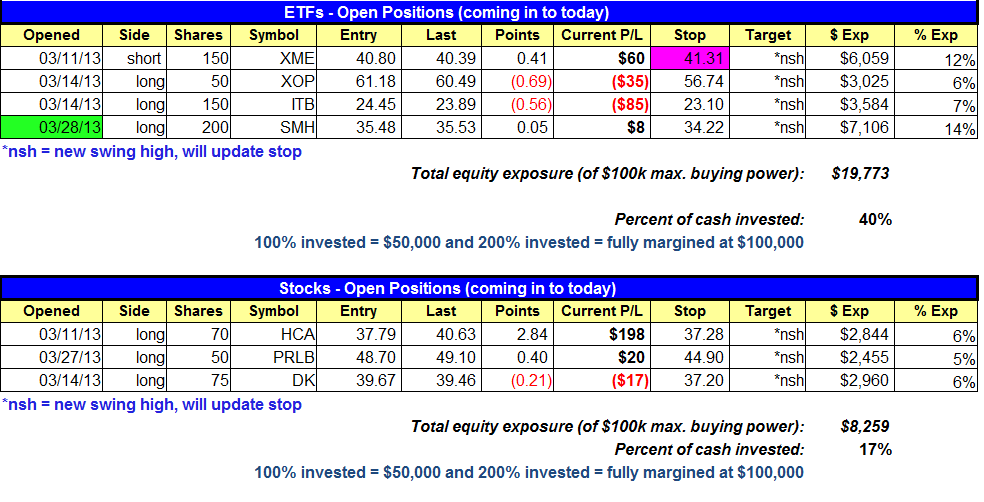
Below is an overview of all open positions, as well as a report on all positions that were closed only since the previous day’s newsletter. Net P/L figures are based on two separate $50,000 model portfolios (one for ETFs and one for stocks). Changes to open positions since the previous report are listed in pink shaded cells below. Be sure to read the Wagner Daily subscriber guide for important, automatic rules on trade entries and exits.

Having trouble seeing the open positions graphic above? Click here to view it directly on your web browser instead.
closed positions:

Having trouble seeing the closed positions graphic above? Click here to view it directly on your web browser instead.
ETF position notes:
- $SMH long triggered.
stock position notes:
- Cancelled $DK, $NTE, and $HOV buy setups.
ETF, stock, and broad market commentary:
Stocks concluded the holiday-shortened week on a positive note last Thursday, as the main stock market indexes rose approximately 0.35% each. The benchmark S&P 500 Index closed at a fresh all-time high, while the NASDAQ Composite finished at its highest level since the year 2000. Surprisingly, turnover in both exchanges was roughly 13% higher than the previous day’s levels. Higher volume levels ahead of three-day weekends are not very common.
In the March 25 issue of The Wagner Daily, we illustrated how PowerShares QQQ Trust ($QQQ) was forming the right shoulder of a bearish head and shoulders formation on its weekly chart. Although that head and shoulders pattern is technically still intact, $QQQ is now trading at the highs of its recent trading range. If $QQQ moves any higher in the coming days, it will break out above the highs of its recent range. If that happens, the right shoulder will become higher than the left shoulder, and there will be increased odds of the head and shoulders pattern transforming into a failed head and shoulders. Below is an updated daily chart of $QQQ:

Since $QQQ never traded below our trigger price for short selling entry (below convergence of the 50-day moving average and March 19 low), a breakout above the highs of the March trading range would have no negative effect on us. On the contrary, failed head and shoulders patterns are actually bullish, because the bears who were betting on lower prices are forced to cover their short positions when the pattern does not follow through to the downside. This is just another example of why our entire trading methodology is based on reacting to price action, rather than predicting it (trading what we see, not what we think).
Recall that we took on additional long exposure last Thursday when Market Vectors Semiconductor ETF ($SMH) triggered for buy entry (initial “starter position”). In our March 28 commentary, we showed you that $SMH was forming a bullish reversal above its nine-year downtrend line. As such, we will be closely monitoring the semiconductor sector this week, as we anticipate bullish follow-through and additional upside gains if institutional funds continue rotating into the semiconductor arena.
Another technology-related ETF we recently discussed is First Trust DJ Internet Index ETF ($FDN). The daily chart pattern of $FDN shown below:

Since its major breakout in January of this year, the late March correction was the first time $FDN pulled back to intermediate-term support of its 50-day moving average since breaking out. Notice how the pullback to the 50-day MA was orderly, and the price has been trading in a tight, sideways range for more than a week.
In the last trading session, $FDN edged just above its 20-day exponential moving average and closed a few pennies above the high of its consolidation that followed the pullback. Because the first pullback to the 50-day moving average that follows a significant breakout creates an ideal, low-risk buying opportunity, $FDN is now poised to move higher in the coming week.
$FDN was added to our “official” watchlist as a potential buy entry last week, and it remains there going into today. Our buy trigger for $FDN is just above the intraday high of March 28 ($43.15), while the protective stop loss is just below the low of the pullback (March 17 low of $42.15). As mentioned late last week, institutions have begun rotating funds into the NASDAQ, which is finally starting to show early signs of relative strength amongst the major indices. If that market trend continues, we should see more clear leadership in both $SMH and $FDN this week.
We have a few new setups on the watchlist for today. We cancelled $NTE and $HOV in favor of $SODA and $GEOS, which we feel are better all around buy candidates. Both $NTE and $HOV remain solid setups that one could play unofficially. We also cancelled the $DK buy setup. We still plan to add to $DK, but we are waiting for a bullish reversal candle to print.
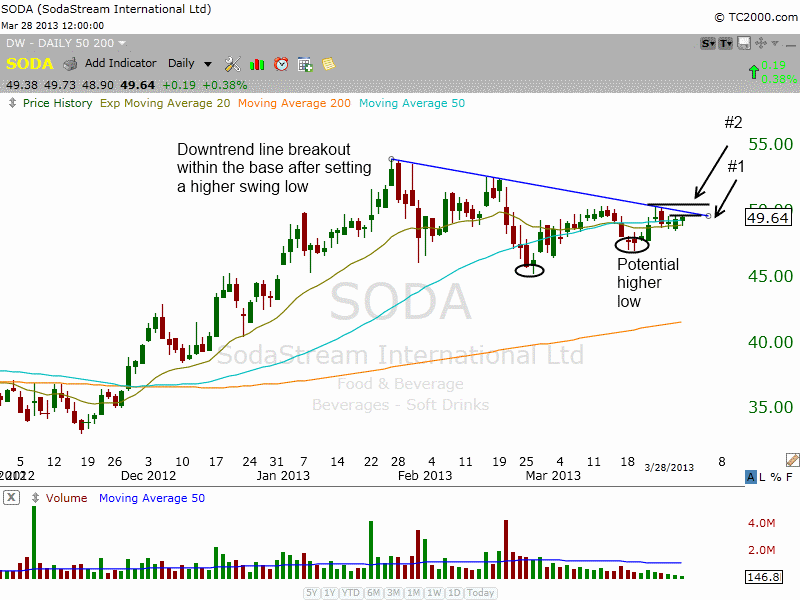
Below is the daily chart of $SODA which has tightened up nicely since bottoming out on 2/26. We have two entry points. The first is a buy entry over the three-day high and the second entry is above the 3/22 high.

SODA has a relative strength ranking of 80, which meets our min. criteria but is a bit low because it has been basing for two months. Its fundamental ranking in 98, with strong earnings and revenues. With only 17 million shares in float, there isn’t much supply out there, so if the price action picks up this stock could run very quickly.
We still like $SWFT for partial size above the two-day high. If this setup triggers we must be patient, as it continues to digest gains from a big move off the lows of 2012.
Our scans continue to produce bullish chart patterns. We have 5 setups on our stock watchlist alone, and there are at least 10 more buy setups that we could have listed with decent potential…so the charts are strong.
relative strength combo watchlist:
Our Relative Strength Combo Watchlist makes it easy for subscribers to import data into their own scanning software, such as Tradestation, Interactive Brokers, and TC2000. This list is comprised of the strongest stocks (technically and fundamentally) in the market over the past six to 12 months. The scan is updated every Sunday, and this week’s RS Combo Watchlist can be downloaded by logging in to the Members Area of our web site.