market timing model: Buy
Current signal generated on close of September 9.Portfolio exposure can be anywhere from 50% to 100% long or more, meaning that conditions are strong enough to be on margin (if you are having plenty of success with your buys). You can not just go from 30% invested to 100% when you feel like it, you have to go from 30% to 60 or 75% and if those positions work, then you can add more.
Past signals:
- Neutral signal generated on close of August 15
- Buy signal generated on close of July 11
- Neutral signal generated on close of July 5
- Sell signal generated on close of June 24
today’s watchlist (potential trade entries):

Below is an overview of all open positions, as well as a report on all positions that were closed only since the previous day’s newsletter. Changes to open positions since the previous report are listed in pink shaded cells below. Be sure to read the Wagner Daily subscriber guide for important, automatic rules on trade entries and exits. Click here to learn the best way to calculate your share size. 
Having trouble seeing the open positions graphic above? Click here to view it directly on your web browser instead.
closed positions:
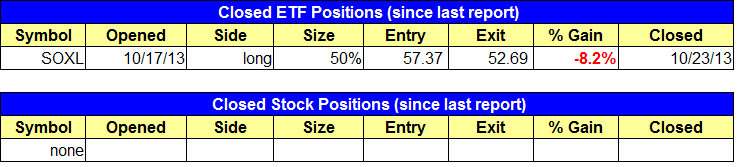
Having trouble seeing the closed positions graphic above? Click here to view it directly on your web browser instead.
ETF position notes:
- An ugly reversal candle in $SOXL triggered our stop and we are out.
stock position notes:
- No trades were made.
ETF, stock, and broad market commentary:
Please note that we will be sending an abbreviated version of the Wagner Daily on the night of October 24 for the Friday, October 25 session. In this version, we will only update the open positions section. The chat room will be closed on Friday as well.
Stocks sold off across the board, with the major averages closing in the -0.3% to -0.7% range. Volume decreased on the NYSE, but picked up on the NASDAQ, producing a bearish distribution day for NASDAQ Composite
With the averages potentially pulling back in by price, or settling into a sideways range (correcting by time), the first touch of the 10-day MA will be quite important. The last two rallies in the market failed to hold the 10-day MA and pulled back in to the 50-day MA over the next few weeks.
Our current long position in the PowerShares Aerospace and Defense ETF ($PPA) held up well yesterday, setting a new all-time closing high on a strong volume. Long positions in $PHO and $IYZ are also holding up well. However, our long entry in iShares Japan ($EWJ) failed Tuesday’s breakout attempt with a sharp reversal to the 20-day EMA. There is support in the $11.50 – $11.85 area, as the price action should hold above the 50-day MA for the trade to remain valid.
After breaking out last week above the highs of the base and the downtrend line, Direxion Daily Financial Bull 3X Shares ($FAS) is pulling back on lighter volume (so far), and should find support around $76, where the downtrend line and the rising 10-day MA are converging. The setup may need two to three more days in pullback mode before it is ready.

Like $FAS, the SPDR S&P Retail ETF ($XRT) is also in pullback mode after breaking out to new highs. We look for the price action to hold the rising 10-day MA, which coincides with the breakout pivot near $83 and the downtrend line. When we say hold, we do not mean that it can’t go below the 10-day MA, as the price action can and usually will undercut a rising moving average to shake out the weak longs.

On the stock side, we’ve been laying low the past week and a half, which has worked out well as there has been quite a bit of volatility in leadership stocks.
$TSLA continues to shake out the weak hands, with yesterday’s undercut of the 50-day MA and the prior swing low. $TSLA did close below the 50-day MA and volume was higher, but the volume wasn’t big enough to suggest that Wednesday’s break of the 50-day MA was a sell signal. So for now, we remain long with no change in stop.
We raised the stop on the 17% position in $SLCA to lock in a 30% gain. We plan to hold the remainig 40% position with a wide stop just below the 50-day MA. We will use the 50-day MA as our guide to sell as long as market conditions remain healthy.
$SFUN has dipped close to our stop price and reversed the past two days. The reason why we are posting this chart is because many traders tend to sell a stock just before it hits the stop thinking that the stop will get hit anyways, and they can save a bit of money by getting out early. It is usually best to avoid exiting a position ahead of the stop, unless your stop is much lower and you are being proactive. Selling out of a position when it is 0.5% to 1.0% above the stop is being reactive. The idea is to plan the trade (accept risk) and then trade the plan (execute).
