market timing model: Buy
Current signal generated on close of September 9.Portfolio exposure can be anywhere from 25% to 100% long depending on how individual setups are holding up. When the broad market averages pullback in (like the Russell has as of late) it’s usually a good time to establish new entries if bullish setups are available. Remember, to add more positions, some of your existing positions must be doing well. Do not add new positions if your first 3-5 selections are not making any progress at all.Past signals:
- Neutral signal generated on close of August 15
- Buy signal generated on close of July 11
- Neutral signal generated on close of July 5
- Sell signal generated on close of June 24
today’s watchlist (potential trade entries):

Having trouble seeing the open positions graphic above? Click here to view it directly on your web browser instead.
open positions:
Below is an overview of all open positions, as well as a report on all positions that were closed only since the previous day’s newsletter. Changes to open positions since the previous report are listed in pink shaded cells below. Be sure to read the Wagner Daily subscriber guide for important, automatic rules on trade entries and exits.

Having trouble seeing the open positions graphic above? Click here to view it directly on your web browser instead.
closed positions:

Having trouble seeing the closed positions graphic above? Click here to view it directly on your web browser instead.
ETF position notes:
- No trades were made.
stock position notes:
- No trades were made.
ETF, stock, and broad market commentary:
Stocks closed higher across the board on declining volume, with small and mid-cap stocks leading the way. The Russell 2000 followed through on Friday’s bullish reversal candle with a 1.2% gain. The S&P 500 and NASDAQ both remain in a tight trading range.
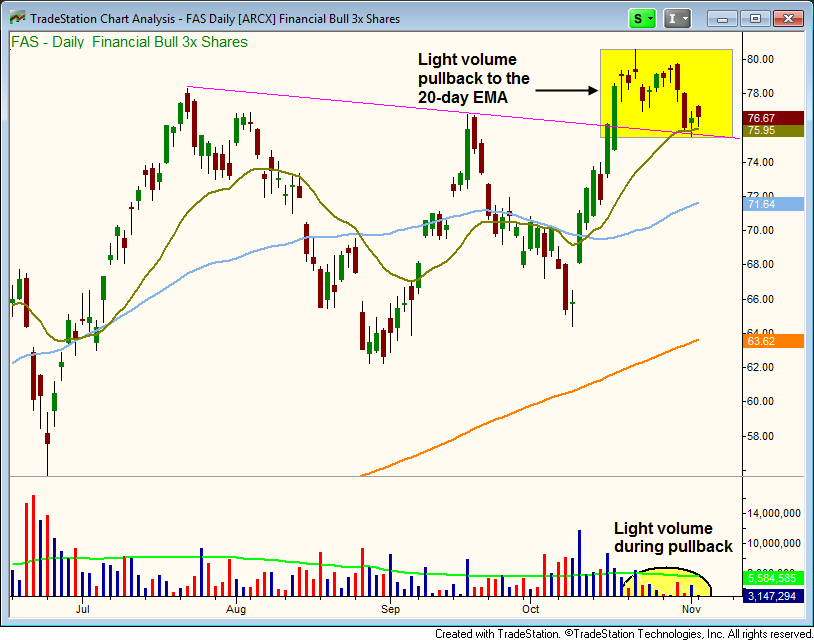
Financial stocks are poised to move higher, as we continue to see bullish consolidations in broker/dealers, insurance, and banking stocks. Due to the all around strength in the sector, we are placing Direxion Daily Financial Bull 3X ETF ($FAS) on today’s watchlist.
The daily chart below shows the bullish, light volume pullback to the rising 20-day EMA. There is also support from the backside of the downtrend line during the consolidation. We are looking for a 20-30% move over the next two to three weeks if the setup triggers.
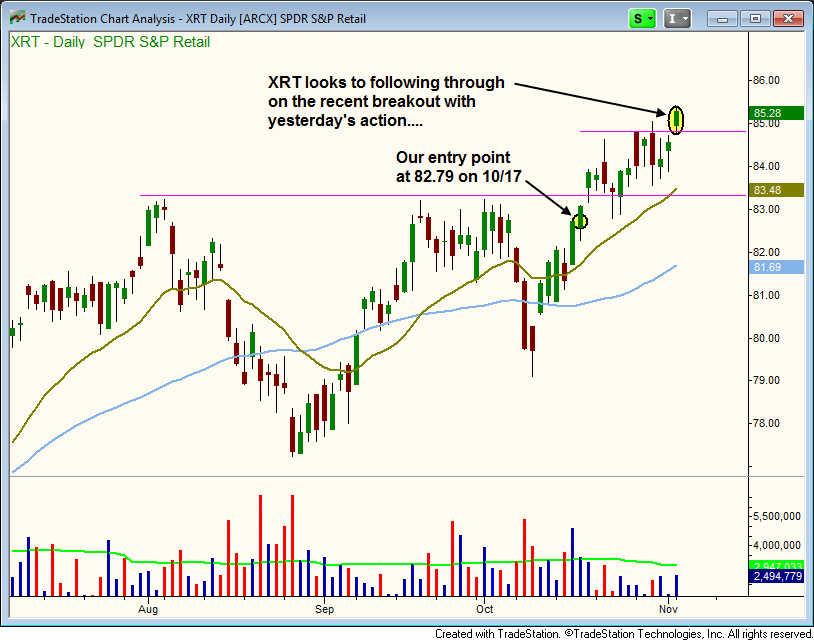
Our long position in $XRT finally pushed through a two-week consolidation on a slight pick up in volume. The 20-day EMA has now cleared the highs of the base, which should provide additional support on any pullback.
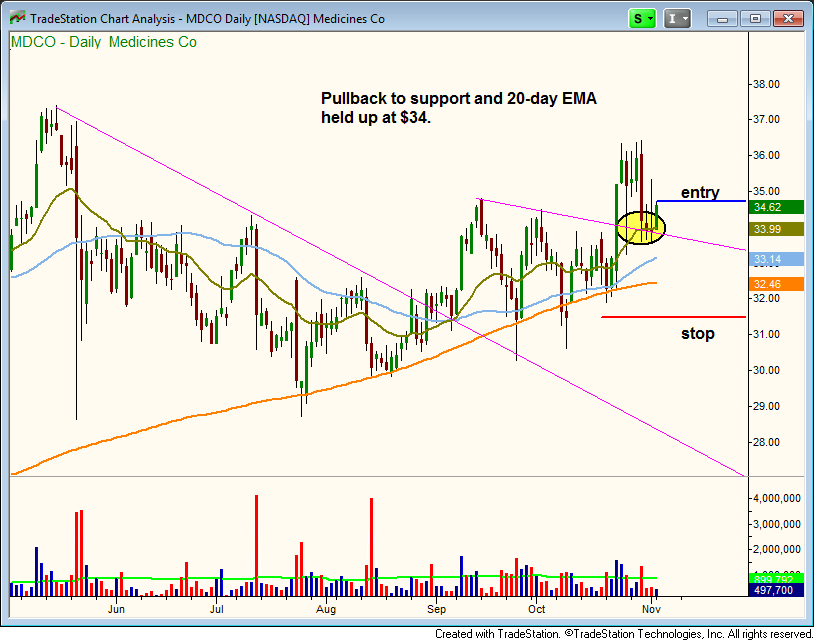
On the stock side, we have one new buy setup in $MDCO, which has formed a 25-week base above the 200-day moving average. Since breaking the downtrend line of the consolidation in September, we have seen higher lows on each pullback off a swing high.
Note that the 50-day and 200-day MAs are trending higher and that all three major averages are in order (20>50 and 50>200).
The recent breakout above $35 failed to hold, but the price action pulled back in to the rising 20-day EMA and the short-term downtrend line. Because the price action has held above the 20-day EMA for three days, we are waiving the 5-minute rule, so if the setup triggers on the open tomorrow we will buy right away.
The stop is placed below the 50 and 200-day MAs.
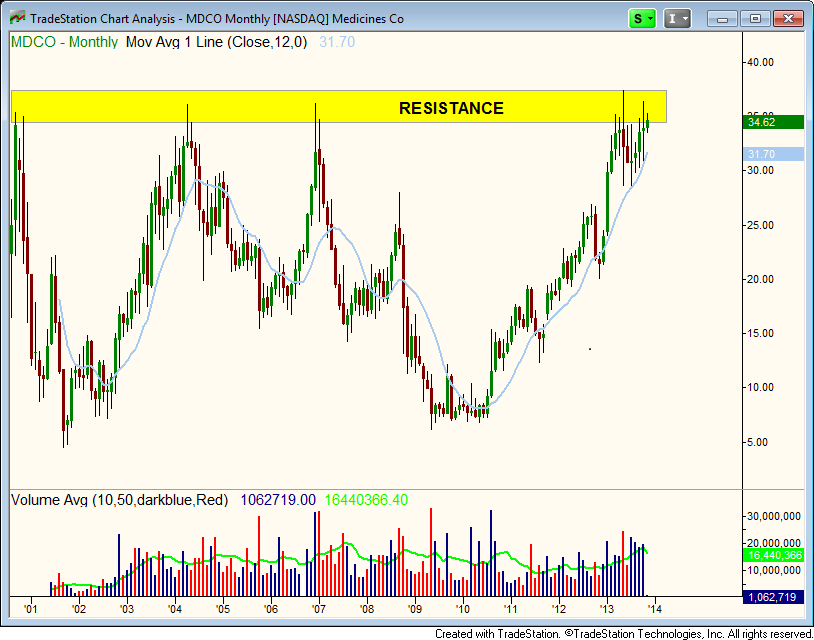
The monthly chart below shows 13 years of resistance in $MDCO around its current level. If $MDCO can clear the $35 – $36 level, then we could see an explosive breakout to new all-time highs over the next few months.
NOTE: $KORS reports earnings after the close on 11/5. We plan to hold through earnings unless our stop is triggered. A more conservative play would be to reduce share size back to 35% before the close if $KORS does not close higher. One could then wait for the gap up to new highs post earnings to add back the shares sold and more.