market timing model:
Sell – Signal generated on the close of October 12 (click here for more details)
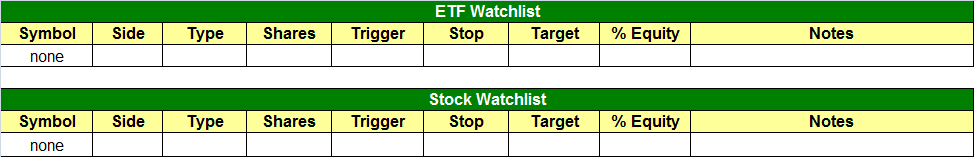
today’s watchlist (potential trade entries):
Having trouble seeing the open positions graphic above? Click here to view it directly on your web browser instead.
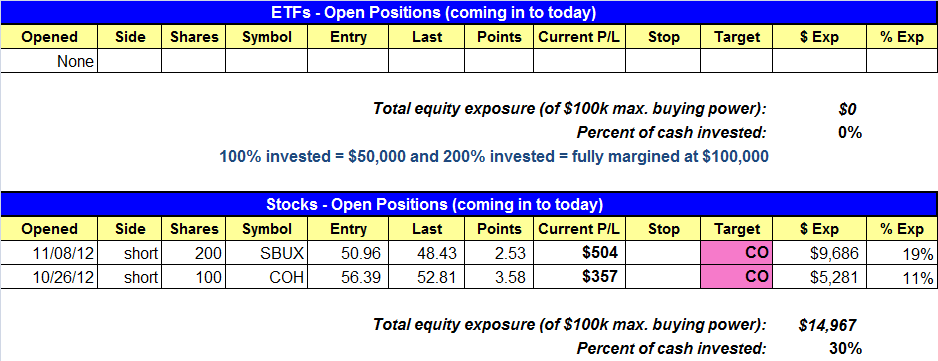
open positions:
Below is an overview of all open positions, as well as a report on all positions that were closed only since the previous day’s newsletter. Net P/L figures are based on two separate $50,000 model portfolios (one for ETFs and one for stocks). Changes to open positions since the previous report are listed in pink shaded cells below. Be sure to read the Wagner Daily subscriber guide for important, automatic rules on trade entries and exits.
Having trouble seeing the open positions graphic above? Click here to view it directly on your web browser instead.
closed positions:

Having trouble seeing the closed positions graphic above? Click here to view it directly on your web browser instead.
ETF position notes:
- SMN hit the target and we are out with a $547 gain (1% of portfolio value). SKF triggered our sell stop for a $227 gain.
stock position notes:
- Note that we are closing out (covering) both short positions on Friday’s open.
ETF and broad market commentary:
After opening near the flatline, the major indices drifted sideways to lower throughout yesterday’s session before closing with moderate losses. The Nasdaq, S&P 500, and Dow Jones Industrials each closed 0.2% to 0.3% lower, while the S&P Midcap 400 and small-cap Russell 2000 indices both fell approximately 0.5%. Considering there could’ve been substantial bearish momentum from the previous day’s weakness, it wasn’t so bad. Nevertheless, buyers remained completely absent, preventing stocks from showing any signs of a significant counter-trend rally attempt. In both the NYSE and Nasdaq, total volume registered just a few percent lower than the previous day’s levels.
In yesterday’s newsletter, we said the stock market may be nearing a significant short-term bottom because Wednesday’s (November 14) price action resembled the start of panic selling that typically precedes exhaustion while in a downward trend. However, given that stocks followed up Wednesday’s session with relatively tame price action yesterday, the market still may need more time to wash out the last of the remaining bulls…or maybe not. So, where does this leave us with our plan of action?
Our market timing model remains in “sell” mode, as it has been since October 12. After shifting from “buy” mode to “neutral” mode on October 5, then shifting from “neutral” mode to “sell” mode on October 12, our objective, rule-based market timing system once again precisely did its job by getting us out of the long side of the market within a few percent of the highs, then prompting us to sell short (and buy inverse ETFs) right before the recent decline picked up substantial downward momentum. However, even though our market timing model is still in “sell” mode, we are now in a situation where the reward to risk ratio for entering new short positions at current levels is simply not very positive.
Extremely short-term traders (such as daytraders) may now be looking for entry points to go long (buy) the market, with the intention of profiting from at least a near-term counter-trend bounce to the upside. However, it’s important to realize that our swing trading strategy is NOT designed to catch every “nook and cranny” of price movement in the stock market. Rather, our trading system and market timing model is designed to position us for only trading in the direction of the dominant market trendand catching the “meat” of each move. Think of it as taking large bites out of the middle of a sandwich, but not eating the crust.
In uptrending markets, for example, we only focus on buying ETFs and stocks on long side of the market. This means we use normal pullbacks to support as buying opportunities to enter new long positions; we do NOT attempt to sell short pullbacks of strong ETFs and stocks if our market timing model is in “buy” mode. Instead, we attempt to sell long positions into strength of each upward thrust, then revert back to cash while waiting for the market to pull back and set up the next low-risk buying opportunities.
The same is true of how we trade in downtrending markets, except in reverse. Now that the broad market is in a confirmed downtrend (at least two lower highs and lower lows have been set), we are NOT interested in trying to buy quick, counter-trend bounces into resistance. Rather, we prefer to keep our powder dry by waiting in cash for ETFs and stocks to rally into new resistance of key moving averages and prior lows, then initiate new short positions (or re-buy inverse ETFs that pull back to support).
On Wednesday, we closed several ETF swing trade positions for a substantial net profit. One day later (yesterday), we closed our remaining two open ETF positions. ProShares UltraShort Basic Materials ETF ($SMN) rallied to our adjusted price target, which enabled us to lock in a 9.2% gain with just an 8-day holding period.Subsequently, ProShares UltraShort Financial ETF ($SKF) pulled back to hit our tightened stop price, which knocked us out of the trade with a decent gain as well. Mid-way through the month of November, we have closed six ETF trades this month. Four of the six trades were winners, equating to a net gain of more than 2% (approx. $1,100) in themodel ETF trading portfolio. During this same period, the Nasdaq Composite has lost 4.7%. Therefore, the ETF trades in our Wagner Daily newsletter have outperformed the Nasdaq by nearly 7% over the past two weeks alone. On the individual stock side, we still have two open short positions that are presently showing a net unrealized gain of approximately 1.7% this month.
We are now back to 100% cash in our model ETF trading portfolio, which is a great place to be considering the current price levels of the market. Now that we are flat, our plan is simply to wait for the broad market to bounce into resistance, then initiate new short positions and/or buy inverse ETFs (as previously explained). Overall, our best plan of action at the moment is to be in “SOH mode” (sitting on hands).
If you are new to short-term trading, you may feel the urge to be actively trading the stock market at all times, either on the long or short side. However, we can assure you that the most profitable swing traders we know are actually out of the market more than they are in the market. But when the signals line up, the reward to risk ratios are good, and entry points are low-risk, the most successful traders take action and aggressively trade in the direction of the dominant market trend. This is exactly what we have done over the past several weeks.
Although this section of our Wagner Daily newsletter normally provides you with technical analysis and a few potential trade setups to consider for swing trade entry, we are not doing that today because it would be a disservice to our subscribers if we suggested buying anything on the long side of the market right now (there is not yet any technical reason to assume the broad market has formed a significant bottom). Likewise, it would be equally risky to enter new short positions right now because the market is overdue for a substantial bounce (the Nasdaq is on pace for its sixth consecutive week of losses). Therefore, after having locked in a nice string of winning ETF trades over the past two days, we are “flat and happy” right now, patiently waiting in “SOH mode” for the market to provide us with our next low-risk swing trading opportunities.

If you’ve been mirroring our swing trades over the past several weeks, you have probably already made enough money to pay for your newsletter subscription for the next year or much longer (depending on the size of your trading account). Even if you’ve only been following our market timing system for your own trades (not following our actual trade picks), you still should have stayed out of harm’s way by exiting all long positions before the decline began. But what if you are a subscriber who somehow lost money over the past several weeks?
If this is the case, we highly suggest you pause and take the time to do an honest, personal reflection of what you did wrong. Were you fighting the dominant market trend? Were you clinging to long positions that should have been sold weeks ago, but you ignored the stops? These are the types of questions you need to ask yourself if you have been losing money lately. Unless you learn from your mistakes and devise a way to prevent repeating them, you will never be a successful trader. Without taking the time for honest self-reflection when losing money, you will not even be aware of any trading mistakes are making. We truly want you to succeed in the stock market, but would you rather learn how to fish, or always have the fish handed to you? When we give you fish, your subscription easily pays for itself many times over. But teaching you how to fish is where the real long-term value of our newsletter subscription lies. Here’s to continued mutual profits and a full bounty of stock market fish for many years to come!
stock commentary:
Due to the substantial selloff in the market during the past two weeks, we are covering both short positions on Friday’s open to lock in gains. Rather than sticking with $SBUX short another day, we felt it was best to lock in a potential 1.0% gain in the portfolio. As with $COH, although it held up a little better than expected, we are still happy to make some money on the short side while sitting mostly in cash the past few weeks.
The short-term plan is to remain in a 100% cash position and see how the action plays out over the next few days. We are not interested in buying stocks with the market timing model still in sell mode.
Below is a quick review of how we methodically re-enter the market after a market correction:
- Broad market price action must stabilize for a few days by not making lower lows
- More than a few market indicators are hovering at extremely oversold levels (there is plenty of bearish sentiment on Wall Street).
- Construct a relative strength watchlist waiting for conditions to settle down.
- After at least three days of no new lows we look for a significant accumulation day in a major average as confirmation that the market is attempting to bottom out. This accumulation day is usually a 1.5-2% gain on higher volume than the prior day’s session.
- Once the key accumulation day is in place we can begin to add long exposure provided that there are valid buy setups to be found. If there are no buy setups we patiently wait for them to develop. Our goal here is to test the long side with 2-4 positions.
- If our 2-4 long positions work out well and market conditions continue to improve, then we can increase our long exposure (more positions and bigger share size). As long as we are receiving positive feedback from our positions and the market the goal is to become 100% invested (or more) as quickly as possible.
If you are a new subscriber, please e-mail [email protected] with any questions regarding our trading strategy, money management, or how to make the most out of this report.
relative strength combo watchlist:
Our Relative Strength Combo Watchlist makes it easy for subscribers to import data into their own scanning software, such as Tradestation, Interactive Brokers, and TC2000. This list is comprised of the strongest stocks (technically and fundamentally) in the market over the past six to 12 months. The scan is updated every Sunday, and this week’s RS Combo Watchlist can be downloaded by logging in to the Members Area of our web site.