Buy Mode
– Timing model generated buy signal on close of March 5 (click here for more details)
today’s watchlist (potential trade entries):

Having trouble seeing the open positions graphic above? Click here to view it directly on your web browser instead.
open positions:
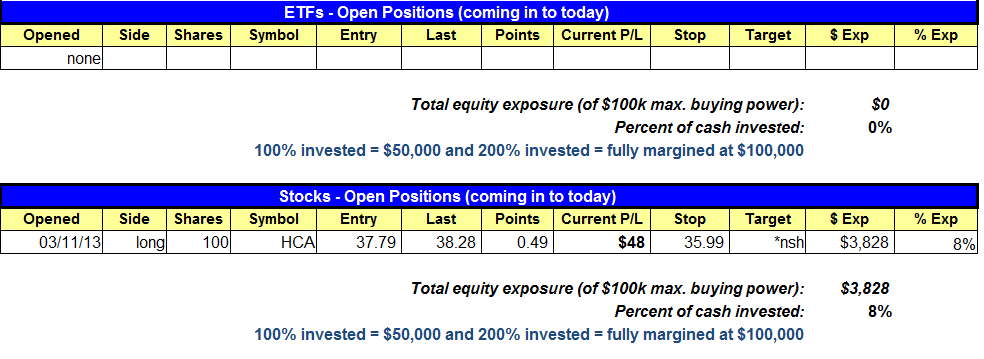
Below is an overview of all open positions, as well as a report on all positions that were closed only since the previous day’s newsletter. Net P/L figures are based on two separate $50,000 model portfolios (one for ETFs and one for stocks). Changes to open positions since the previous report are listed in pink shaded cells below. Be sure to read the Wagner Daily subscriber guide for important, automatic rules on trade entries and exits.
Having trouble seeing the open positions graphic above? Click here to view it directly on your web browser instead.
closed positions:

Having trouble seeing the closed positions graphic above? Click here to view it directly on your web browser instead.
ETF position notes:
- $XME is a sell limit order, to short on a bounce.
stock position notes:
- $SWFT is a buy limit order, to buy on a pullback.
ETF, stock, and broad market commentary:
A choppy, noncommittal session of trading yesterday led the S&P 500 and Nasdaq Composite to eke out closing gains of 0.1%, while the Dow Jones Industrial Average was unchanged. Overall, the session was simply a consolidation day for the broad market, which was confirmed by lighter volume across the board. Total volume in both the NYSE and Nasdaq was 5% less than the previous day’s levels. This was positive because higher volume on a flat day with stocks trading at their highs would have pointed to bearish “churning.”
In yesterday’s ETF commentary, we pointed out the developing bullish setup in SPDR Energy ETF ($XLE). However, as the ETF had not yet broken out to new highs, we said it may need another week or two of consolidation, as well as tightening of the price action near its prior high.
While $XLE remains on our internal watchlist as a potential buy entry in the near-term, further research enabled us to actually find a better ETFs swing trade setup within the same industry sector. Below, take a look at the daily chart of SPDR Oil & Gas Exploration and Production ETF ($XOP):
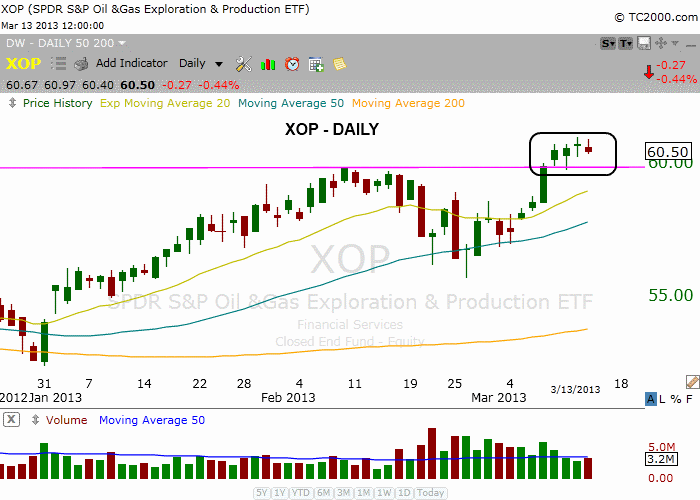
The primary difference between $XLE and $XOP is that the former has not yet broken out above resistance of its February 2013 high, while the latter already has. This means $XOP has been showing slightly more relative strength than $XLE. On the longer-term weekly chart, notice that $XOP has also just broken out above key horizontal price resistance of its prior high from September of 2012, which should further spark bullish momentum from here:
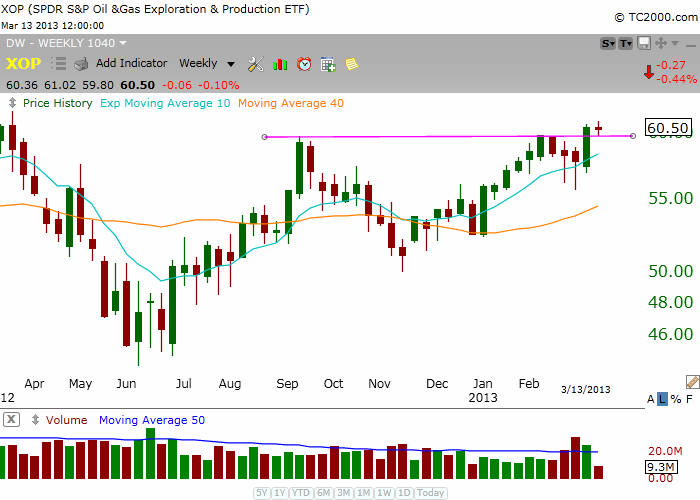
Over the next few days, $XOP may form a bull flag chart pattern by drifting slightly lower from the high of this week’s breakout (as shown on the first chart above). If it does, it could lead to an ideal swing trade setup, as new support of the February 2013 breakout level is just below the current price. However, just in case the ETF immediately continues higher from here, without forming a bull flag first, we have added $XOP to today’s watchlist as an “official” trade setup going into today’s session.
Since $XOP is presently only 1% above its breakout level, it’s not too far extended to take a shot from here if it continues higher. However, if the ETF trades through our trigger price (above the two-day high), we will reduce risk by only entering with partial share size on this momentum trade setup. Conversely, we may be more inclined to enter with larger share size if a bull flag pattern first develops from here instead, as that would increase the odds of follow-through to the upside.
In addition to the $XOP setup, subscribers should note there are two other “official” ETF trade setups today as well.
One new ETF setup is a buy entry into ProShares Short 20+ Year Treasury Bond ETF ($TBF) if it rallies above last week’s high. A similar trade to buy $TBT on a breakout above last week’s high was listed on our watchlist earlier this week (Monday), but it did not trigger and we removed it. Now, we have added the short ETF back to our watchlist, but are targeting the non-leveraged ETF ($TBF) rather than the leveraged one ($TBT) because there will be a slightly better correlation to the underlying index if $TBF triggers for buy entry. Please reference the March 11 issue of The Wagner Daily for a technical review of this setup to short the long t-bonds with an inversely correlated “short ETF.”
The third and final new setup on today’s watchlist is a potential short selling entry into SPDR Metals & Mining ETF ($XME). Although our market timing model is in “buy” mode, this sector has been absolutely dead, trading near the 52-week lows while the market trades at its highs. Therefore, because of its relative weakness, even the slightest pullback in the market should cause this ETF to fall apart to new lows.
Note that the trigger price for $XME is a SELL LIMIT order, not a sell stop. This means we will only sell short if $XME bounces up to that limit price or better (which is roughly a 50% retracement of yesterday’s sell-off). We will explain the technical criteria behind this setup in tomorrow’s newsletter, but have listed it as an “official” setup in the meantime. By the way, if you receive a message from your broker that shares are unavailable for short selling, we suggest calling your broker and asking them to “locate” shares for borrowing.
With an actual phone call, most decent brokers can locate shares for you, despite the messages their online trading platforms may spit out. If that still doesn’t work, consider opening a second trading account at a firm that actually caters to active traders, such as TradeStation or Interactive Brokers (where you can borrow shares of and sell short just about every stock and ETF on the market).
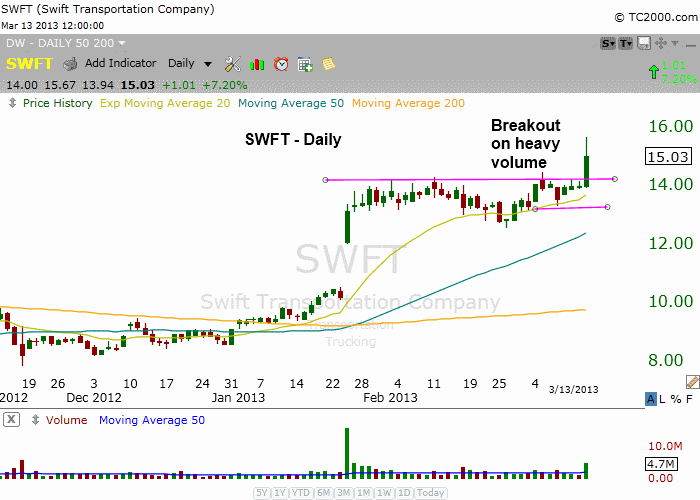
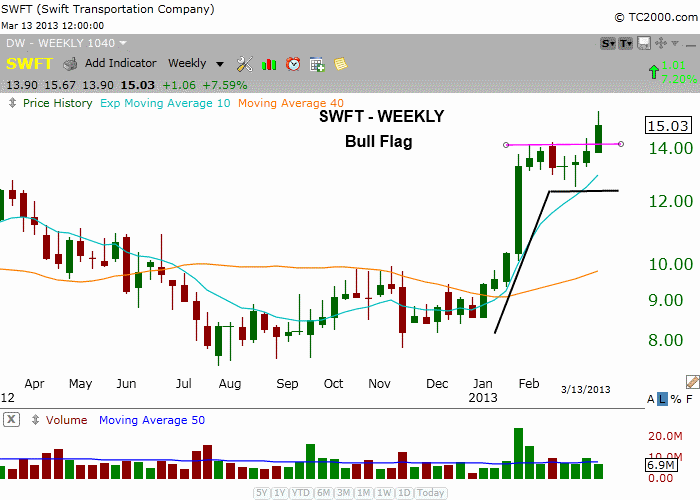
We have two new buy setups on today’s watchlist in $ALNY and $SWFT. Please note that SWFT is a buy limit order, which means we are looking to buy on weakness only if the price pulls back to our trigger. $SWFT broke out on strong volume above a 5-week base. We are looking for a slight pullback on the open as the entry on the daily chart. The weekly chart shows the powerful advance off the lows, which created a bull flag pattern. The 10-weeek MA has crossed above the 40-week MA and ripped higher, which signals a bullish reversal of the trend.
 We posted a chart of $ALNY in yesterday’s report and still like the setup so we are making it official. Please note the light share size on both setups. As we have mentioned the past two weeks, we have mixed signals with our system due to the light volume in the market during the recent advance. However, price action is always king, so by reducing our share size we can remain with the trend while not ignoring the warning signs.
relative strength combo watchlist:
Our Relative Strength Combo Watchlist makes it easy for subscribers to import data into their own scanning software, such as Tradestation, Interactive Brokers, and TC2000. This list is comprised of the strongest stocks (technically and fundamentally) in the market over the past six to 12 months. The scan is updated every Sunday, and this week’s RS Combo Watchlist can be downloaded by logging in to the Members Area of our web site.