market timing model:
Confirmed Buy – Signal generated on the close of September 4 (click here for more details) (we are on a buy signal from the close of Aug. 16)
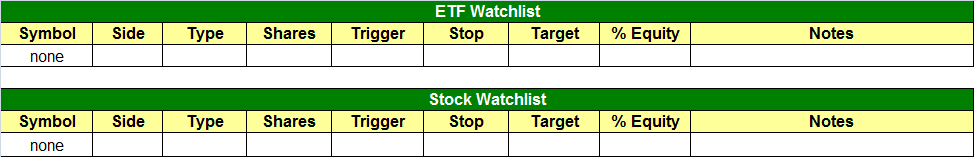
today’s watchlist (potential trade entries):
Having trouble seeing the open positions graphic above? Click here to view it directly on your web browser instead.
open positions:
Below is an overview of all open positions, as well as a report on all positions that were closed only since the previous day’s newsletter. Net P/L figures are based on two separate $50,000 model portfolios (one for ETFs and one for stocks). Changes to open positions since the previous report are listed in pink shaded cells below. Be sure to read the Wagner Daily subscriber guide for important, automatic rules on trade entries and exits.
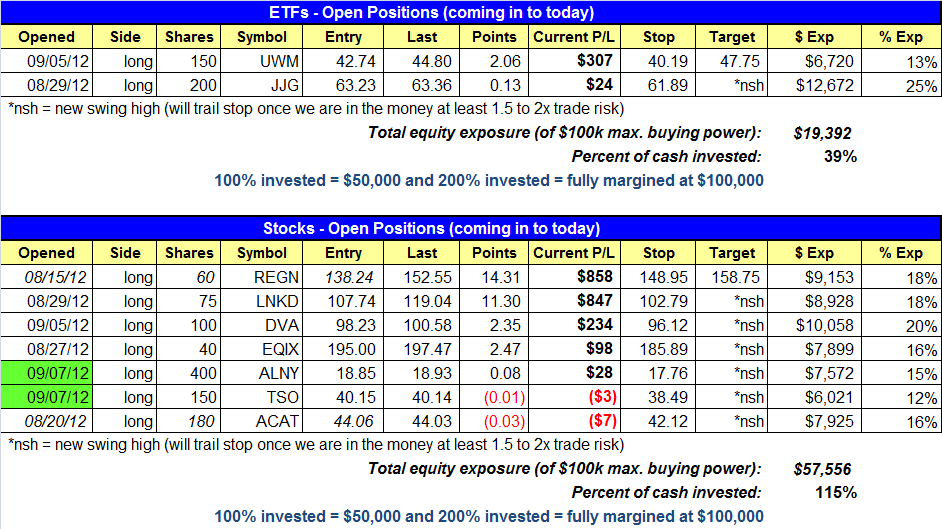
Having trouble seeing the open positions graphic above? Click here to view it directly on your web browser instead.
closed positions:
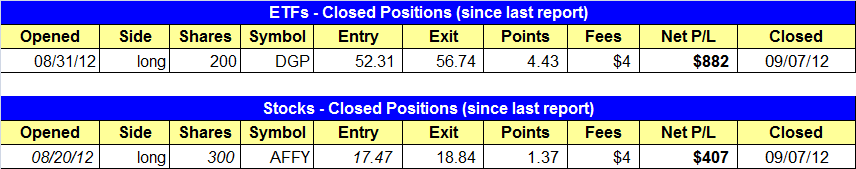
Having trouble seeing the closed positions graphic above? Click here to view it directly on your web browser instead.
ETF position notes:
- Sold DGP and locked in a near $900 gain on an 8% move from the entry.
stock position notes:
- Sold AFFY on the open for a $400 gain.
ETF and broad market commentary:
Stocks followed up the previous day’s big breakout with a tight-ranged day of consolidation last Friday. The S&P 500 ($SPX) gained 0.4%, the Dow Jones Industrial Average ($DJIA) edged 0.1% higher, and the Nasdaq Composite was unchanged. Both the small-cap Russell 2000 ($RUT) and S&P MidCap 400 ($MID) indices ticked 0.5% higher. Trading almost perfectly sideways throughout the entire session, all the major indices basically closed the day where they opened.
Total volume in the NYSE was 6% lighter than the previous day’s level, while turnover in the Nasdaq eased 10%. In the NYSE, advancing volume exceeded declining volume by a respectable margin of 5 to 2. The Nasdaq ADV/DEC volume ratio was in parity. Overall, it was a relatively quiet session, which is perfectly acceptable following a significant breakout like the market experienced the preceding day.
On Thursday, September 6, we reported that we sold iShares Nasdaq Biotechnology Index ($IBB) for a 5% price gain when it hit its price target on Wednesday. Last Friday, one day later, DB Gold Double Long ($DGP) hit its target as well, causing us to sell it for a gain of 8.5% with a holding period of less than a week. Our entry and exit prices in DGP are shown on the daily chart below:

Since both gold and silver ETFs just broke out above resistance of their one-year downtrend lines in late August, we reiterate that these precious metals ETFs will probably continue moving higher in the intermediate-term. However, we had a choice of taking the “easy” money on the initial quick pop OR sitting through the first pullback in anticipation of the next leg higher in DGP. Obviously, we chose the first option because we liked the idea of locking in substantial gains on a few winning ETF trades (IBB and DGP back-to-back), which generally have not been showing much momentum or follow-through for at least several months. Nevertheless, we will definitely keep the gold ETFs on our radar screen for potential swing trading re-entry. It is too early to determine the price at which we would re-enter DGP because it depends where the ETF starts to pull back from its breakout. As a rough guide, we will initially be looking for a retracement to the area of the 20-day exponential moving average OR the formation of a bull flag chart pattern. As always, subscribers will be notified of our exact entry, stop, and target price on the ETF Watchlist section of the newsletter when DGP meets our criteria for re-entry.
The PowerShares QQQ Trust ($QQQ), which tracks the performance of the tech-heavy Nasdaq 100 Index, finished last week at its highest closing price since December of 2000. Stocks and ETFs trading at fresh 52-week highs or multi-year highs typically move substantially higher with only the slightest amount of buying pressure due to the lack of price resistance and overhead supply from investors who bought at higher levels and would otherwise be selling into strength of the move. For this reason, long-time subscribers of this newsletter know that buying breakouts to new 52-week highs is our main preferred strategy for swing trading in uptrending markets. The rest of the main stock market indexes are now trying to catch up to the Nasdaq 100, which should be positive for the overall broad market. With our market timing model now in “confirmed buy” mode, we will continue looking for low-risk entry and re-entry points in the strongest ETFs (and stocks).
stock commentary:
We established two new long positions yesterday in TSO and ALNY, brining our exposure up to 115%. We’d like to get to the 150-180% level if the market continues to act well and new setups emerge.
After almost stopping us out a few times, ACAT continues to hold above the 20-day EMA in a tight range. For those who missed the initial entry, there is a second entry point above the high of 9/6.

If you are a new subscriber, please e-mail [email protected] with any questions regarding our trading strategy, money management, or how to make the most out of this report.
relative strength combo watchlist:
Our Relative Strength Combo Watchlist makes it easy for subscribers to import data into their own scanning software, such as Tradestation, Interactive Brokers, and TC2000. This list is comprised of the strongest stocks (technically and fundamentally) in the market over the past six to 12 months. The scan is updated every Sunday, and this week’s RS Combo Watchlist can be downloaded by logging in to the Members Area of our web site.