market timing model:
Buy – Signal generated on the close of August 16 (click here for more details)
today’s watchlist (potential trade entries):

Having trouble seeing the open positions graphic above? Click here to view it directly on your web browser instead.
open positions:
Below is an overview of all open positions, as well as a report on all positions that were closed only since the previous day’s newsletter. Net P/L figures are based on two separate $50,000 model portfolios (one for ETFs and one for stocks). Changes to open positions since the previous report are listed in pink shaded cells below. Be sure to read the Wagner Daily subscriber guide for important, automatic rules on trade entries and exits.

Having trouble seeing the open positions graphic above? Click here to view it directly on your web browser instead.
closed positions:
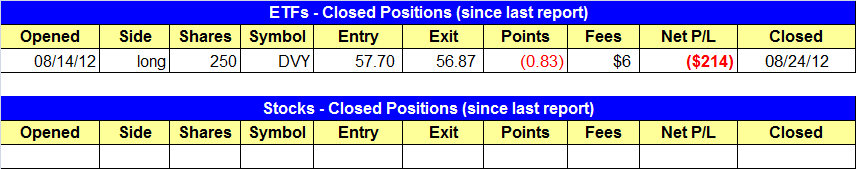
Having trouble seeing the closed positions graphic above? Click here to view it directly on your web browser instead.
ETF position notes:
- DVY stop triggered, as our stop was exactly equal to the low of the day. We no longer like this setup and are not considering re-entry in the near future.
- The trade setup to add additional shares of $IBB triggered. It is listed twice in the open positions section due to the “split stop” of the position.
stock position notes:
- No trades were made.
ETF and broad market commentary:
Initially following through on the previous day’s weakness, stocks gapped lower on last Friday’s open. However, buyers immediately stepped in to reverse the intraday trend to the upside. Perfectly bouncing off near-term support of its 20-day exponential moving average, the benchmark S&P 500 ($SPX) rallied 0.7%. The Dow Jones Industrial Average ($DJIA) similarly gained 0.8%, as the Nasdaq Composite ($COMPQ) rose 0.5%. This time, small and mid-cap stocks lagged behind. The small-cap Russell 2000 and S&P MidCap 400 increased 0.4% and 0.3% respectively. Despite a bit of volatility into the close, all the main stock market indexes finished near their intraday highs.
As has been the case throughout most of the month, turnover remained light. Total volume in the NYSE was 12% lower than the previous day’s level, while volume in the Nasdaq ticked 4% lower. In the NYSE, advancing volume exceeded declining volume by a spread of just over 2 to 1. The Nasdaq adv/dec volume ratio was positive by just a slightly lower margin. Failing to confirm the positive closing prices in the broad market, trade in both exchanges remained below 50-day average levels. In the NYSE, volume has limped in lighter than average for the past 14 sessions. But as we’ve mentioned several times in recent weeks, this type of dull action is typical during the summer doldrums. The good news is that we will likely see the return of institutional trading activity after the passing of the Labor Day holiday one week from now.
One ETF on our radar screen for potential buy entry this week is SPDR Gold Trust ($GLD), a commodity ETF that tracks the price of spot gold futures. We have not discussed this ETF for a long time because it has been in correction mode, retracing from its all-time high, for nearly a year. It has also been rather flat for the past several months. However, upon closer examination of the big picture, we see that momentum of $GLD may now be reversing, which could provide for a solid swing trading opportunity on the long side. begin with, notice the breakout above the 200-day moving average that occurred just last week:

As you can see, $GLD rallied to close above major resistance of its 200-day moving average (on August 22) for the first time since March of this year. Increasing volume, which rose above its 50-day average level, helped to confirm the move. In the subsequent two days that followed the breakout above its 200-day MA, $GLD traded in a tight, sideways range. However, although such price action is bullish, the daily chart pattern presently does not yet provide us with a clearly defined buy entry point and level for setting a stop price. For that, we would need to see at least a one or two-day pullback that ideally forms a reversal candle. If that occurs, the levels for setting our buy trigger and stop prices would be much more clearly defined. As annotated in the chart above, we would ideally like to see a quick pullback to near new support of its 200-day MA (the orange line), presently just above the $160 level. Another reason we would first like to see a minor price retracement from current levels before buying is that the long-termmonthly chart interval shows us that $GLD is actually running into resistance of its downtrend line from its September 2011 high:

If $GLD is bumping into resistance of a downtrend line that has been in place for nearly one full year, one may be wondering why we would be considering buying this ETF on a pullback before it actually breaks out above resistance of that downtrend line. There are several reasons. Perhaps most importantly, one must remember the basic tenet of technical analysis that states a longer-term trend always holds more weight than a shorter-term trend. Therefore, even though $GLD is kissing resistance of a downtrend line that is nearly 12 months old, notice more importantly that this ETF has clearly been in a dominant uptrend since at least 2006. As such, technical analysis dictates that the odds favor an eventual resumption of that multi-year uptrend. Although the current one-year pullback off the high has been rather lengthy, it was merely proportionate (in the big picture) to the duration and extent of the uptrend for the past 6 years.
In addition to the long-term uptrend being more powerful than the shorter-term downtrend, notice how the price action of $GLD has perfectly held support of the 20-period exponential moving average (the beige line) for the past three months. While doing so, price action also tightened up dramatically, creating a volatility contraction that should soon lead to a significant volatility contraction. Checking the volume pattern, we also notice that volume declined dramatically during the consolidation of the past several months. This tells us the sellers have been drying up, thereby making it easier for $GLD to eventually break out and attempt to resume its dominant upward trend. Finally, because $GLD is a commodity ETF, it has very low correlation with the direction of the main stock market indexes. That’s why we do not view this trade as having relative weakness to the broad market.
Overall, we like the technical setup for a momentum-based swing trade buy entry into $GLD, but we will patiently wait for a proper entry point first. When the trade setup meets our criteria for potential buy entry, the exact buy trigger, stop, and target prices will be listed here in the watchlist of the newsletter. Until then, we will continue to closely monitor the price and volume action of $GLD.
Although iShares Mexico Index ($EWW) hit our stop price and knocked us out of the trade last week, its chart pattern is now ideal for potential re-entry into the trade. Take a look:

Notice that $EWW formed a nice bullish reversal bar after perfectly bouncing off intermediate-term support of its 50-day moving average last Friday. It also did so on higher volume, indicating institutional buying support. Now, a rally above the three-day high would correlate to a breakout back above its 20-day exponential moving average. If that happens, we anticipate $EWW to breakout to a fresh all-time high because last week’s pullback shook out the “weak hands” and therefore absorbed any remaining overhead supply that would otherwise hold the trade down. Because our entry and stop prices can now be easily defined for entry into $EWW, you will notice it is listed on our ETF watchlist as an “official” trade setup today.
We’ll conclude with just a reminder that each and every trade we enter stands on its own merits and is independent of any other trades. Therefore, it’s important to not be obsessed or feel regret that we sold $EWW at a lower price last week then where we are looking to get back in the trade. Selling was the proper thing to do because the initial breakout attempt failed. But now that $EWW has perfectly set up for re-entry, we will buy it again (assuming it triggers) without the slightest ounce of regret or consideration that we just sold the trade for a small loss last week. For more thoughts on feelings of regret in trading, as well as other dangerous emotions, please check out this article that we recently posted about trading psychology.
stock commentary:
While many traders constantly get caught up or obsessed with finding new technical indicators to aid their decision making, we always try to keep it simple by scanning a few hundred stock charts each night (good old fashioned elbow grease, but now aided by our stock screener). This routine is invaluable, as it allows us to trade the market without having to make any bold predictions. This is an important concept that most traders overlook. We do not need to know where the market is headed to make money.Rather than wasting time on predicting where a market is headed, we cycle through the charts and note what is going on right now. We trade in the moment, and therefore do not need to make any predictions. If the market is healthy, there is little to no institutional distribution, and the chart patterns look bullish, then we buy. Conversely, if our positions and the major indices begin breakind down below significant support levels on heavy volume, then we usually get stopped out and simply move into cash (or sell short only if the dominant trend reverses). The beauty of our trading strategy is that no predictions are necessary, we simply go with the flow.
While our weekend scans produced some bullish setups, we have yet to see much separation in our stocks from the original buy points. This has us slightly cautious in that we would prefer to see our stocks extend higher before taking on much more risk. We do have one new official stock buy setup listed today ($EQIX), which has two different buy scenarios listed below. Whichever setup triggers first is the one we will take. The other setup will then be cancelled. Note that only one setup can trigger. Below are charts that show the buy entry setup for either scenario:
Breakout Buy:

Pullback Buy:

If you are a new subscriber, please e-mail [email protected] with any questions regarding our trading strategy, money management, or how to make the most out of this report.
relative strength combo watchlist:
Our Relative Strength Combo Watchlist makes it easy for subscribers to import data into their own scanning software, such as Tradestation, Interactive Brokers, and TC2000. This list is comprised of the strongest stocks (technically and fundamentally) in the market over the past six to 12 months. The scan is updated every Sunday, and this week’s RS Combo Watchlist can be downloaded by logging in to the Members Area of our web site.