market timing model: BUY
Current signal generated on close of November 13.
Portfolio exposure can be anywhere from 50 to 100% long. If positions are holding up well, then one can add exposure beyond 100%.
Past signals:
- Neutral signal generated on close of November 6.
- Buy signal generated on close of September 9
- Neutral signal generated on close of August 15
- Buy signal generated on close of July 11
- Neutral signal generated on close of July 5
- Sell signal generated on close of June 24
today’s watchlist (potential trade entries):

Having trouble seeing the open positions graphic above? Click here to view it directly on your web browser instead.
open positions:
Below is an overview of all open positions, as well as a report on all positions that were closed only since the previous day’s newsletter. Changes to open positions since the previous report are listed in pink shaded cells below. Be sure to read the Wagner Daily subscriber guide for important, automatic rules on trade entries and exits.

Having trouble seeing the open positions graphic above? Click here to view it directly on your web browser instead.
closed positions:
Having trouble seeing the closed positions graphic above? Click here to view it directly on your web browser instead.
ETF position notes:
- Removed $EWW from the watchlist for now.
stock position notes:
- $SCTY add triggered.
ETF, stock, and broad market commentary:
Stocks kicked off the new trading year with a bearish distribution day, as the major averages sold off across the board with losses in the -0.8% to -1.1% range. The market was overbought in the short-term, so we look for a few days of corrective price action to help produce new buy setups on minor weakness.
Whenever there is distribution in a good market, we typically see money flowing out of extended groups and into groups that have been basing out for a few weeks or more. Yesterday, it was very clear that money was flowing into solar stocks with Solar ETF ($TAN) gaining more than 7% on heavy volume. We are currently long $SCTY in the stock portfolio, which rallied 5% yesterday and is now up over 11% from our entry on 12/19.
With the gold ETF ($GLD) rallying 1.6%, our short position in the inverted gold ETF ($DZZ) is now under pressure. While $GLD could rally in the short-term, it remains in an ugly downtrend on the weekly chart and could have plenty of trouble clearing the 50-day MA and downtrend line at $120.
Looking at the chart of Gold Double Short ETF ($DZZ), we see the price action has undercut the 20-day EMA and the prior breakout level at $7.55. There is plenty of support in the $7 area, which is where the rising 50-day MA and the prior swing low are currently sitting.
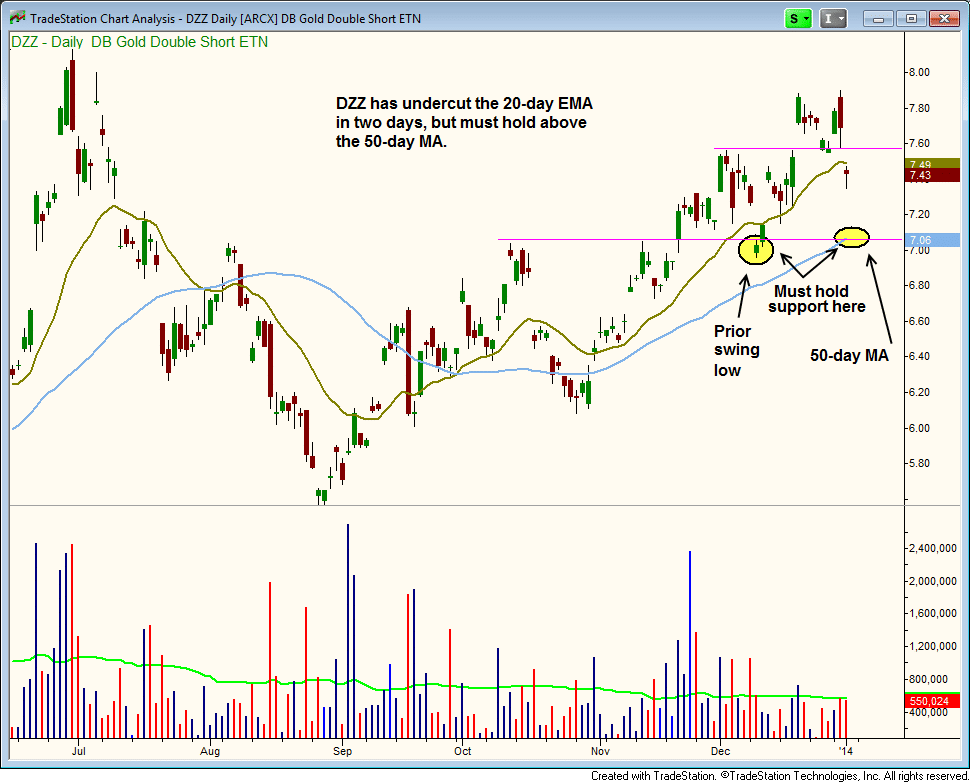
Rather than trying to raise the stop here to limit losses, we are more inclined to let the trade play out due to support at $7.
One of the few ETFs to close up on the day, Global X Greece ETF ($GREK), closed near the highs of a two month long base. The tight base has formed at 52-week highs, so after failing to breakout above prior highs in February and May of last year, $GREK looks poised to run to new highs soon.
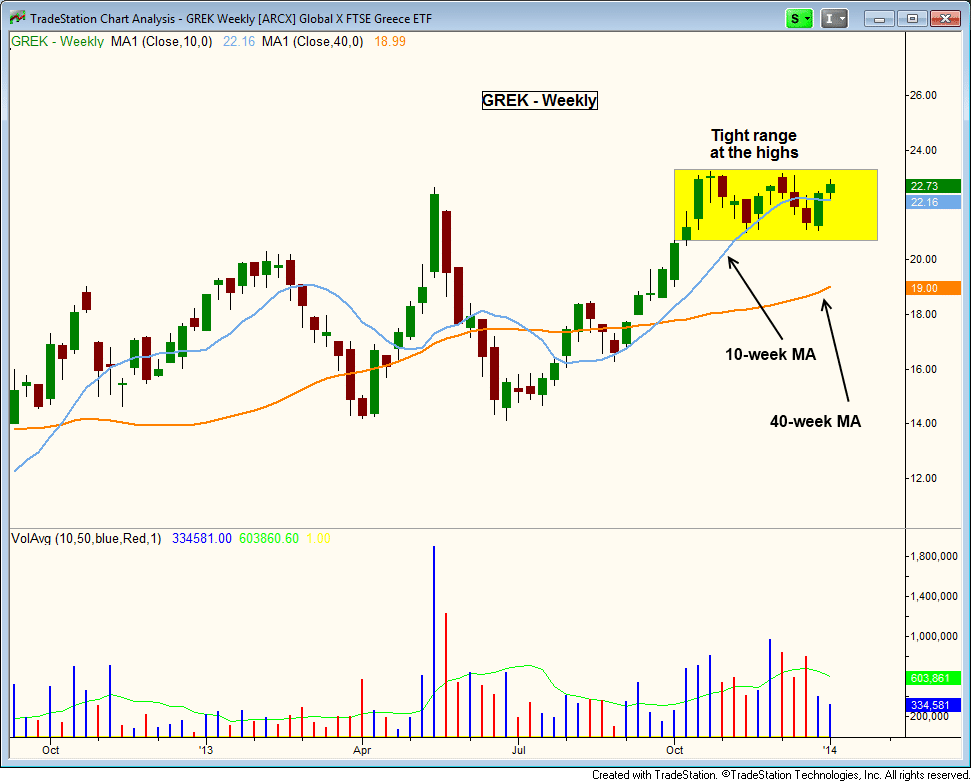
Prior to breaking out, we look for the action to pull back in and tighten up while holding above the 50-day MA. This tightening of the price action is what we always look for in a quality basing pattern.
We would actually like to see a false breakout in $GREK above the current highs, followed by a three to five bar selloff to scare off all the longs who bought in late. These type of selloffs can produce low risk entry points.
On the stock side, we added to a current long position in $SCTY, and we are now up to a 75% position.
$YNDX has stalled out on light volume after breaking out to new all-time highs. We’d like to see a slight pullback from its current level to produce a low risk entry point, which would be somewhere around the $40.70 to $41.70 area.
$GOGO over yesterday’s high could produce a possible short-term trade (2-3 day pop), as there is still some overhead around the $28 – $29 level. $GSM above 18.07 could also be in play, as could $CADX above 9.22.