market timing model:
Sell – Signal generated on the close of October 12 (click here for more details)
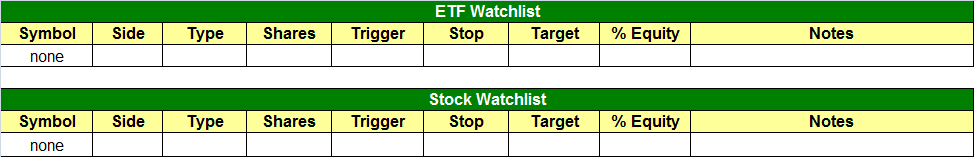
today’s watchlist (potential trade entries):
Having trouble seeing the open positions graphic above? Click here to view it directly on your web browser instead.
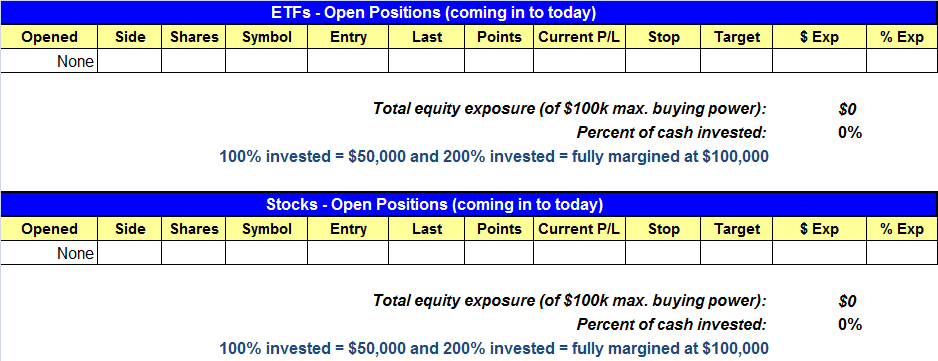
open positions:
Below is an overview of all open positions, as well as a report on all positions that were closed only since the previous day’s newsletter. Net P/L figures are based on two separate $50,000 model portfolios (one for ETFs and one for stocks). Changes to open positions since the previous report are listed in pink shaded cells below. Be sure to read the Wagner Daily subscriber guide for important, automatic rules on trade entries and exits.
Having trouble seeing the open positions graphic above? Click here to view it directly on your web browser instead.
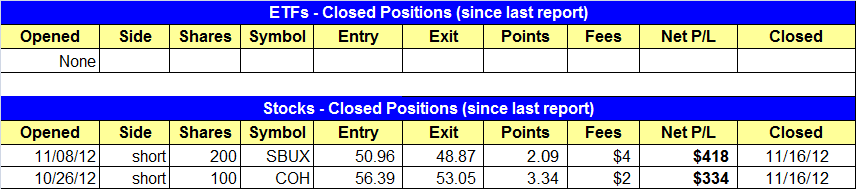
closed positions:
Having trouble seeing the closed positions graphic above? Click here to view it directly on your web browser instead.
ETF position notes:
- No trades were made.
stock position notes:
- Covered $COH and $SBUX to lock in gains.
ETF and broad market commentary:
Initially building on bearish momentum from the preceding days, stocks continued lower throughout the first half of last Friday’s session, but afternoon buying interest enabled the Nasdaq, S&P 500, and Dow Jones to reverse their intraday losses and close an average of 0.5% higher. Showing relative strength, the small-cap Russell 2000 and S&P Midcap 400 indices both climbed approximately 0.8%. Turnover in both exchanges rose modestly above the previous day’s levels, but much of the volume increase was likely the result of last Friday being monthly options expiration day.
The intraday price action of last Friday caused the main stock market indexes to form bullish hammer candlestick patterns. When this pattern occurs after a protracted downtrend, it frequently leads to at least a very near-term reversal of price momentum. However, in order for the pattern to be confirmed, prices should first gap above their previous day’s highs. If that occurs in today’s session, odds technically favor an upward bias over the next several days (or more). Below, we have annotated the bullish hammer candlestick pattern on the daily chart of PowerShares QQQ trust ($QQQ), a popular ETF proxy for the Nasdaq 100 Index:

We closed the last of our open “short ETF” positions into broad market weakness on November 15, and subsequently closed our remaining two individual stock short positions the following morning, locking in substantial gains on both trades. After carefully exiting all remaining bearish positions near the lows of the current move down, right before the Friday afternoon reversal, we are now 100% flat and happy.
In the November 16 issue of The Wagner Daily, we diverted from the usual format to provide you with a valuable, educational article on trading psychology. Specifically, we explained the importance of knowing when to be in SOH mode (sitting on hands). Although that day’s commentary was lengthier than usual, it was an opportune time to remind you that cash is indeed a valid position for traders, especially when at or nearing pivotal periods in the stock market.
Based on the bullish hammer patterns that many stocks formed last Friday, the broad market may finally see a decent bounce off the lows. But rather than attempting to trade a quick, counter-trend bounce on the long side of the market, we prefer to patiently wait in cash for stocks to bounce into significant resistance levels that will enable us to re-enter the short side of the market at low-risk entry points. Again, our rationale for waiting in cash when the market bounces was thoroughly explained in our most recent commentary. Here’s a recap: Just as we only use counter-trend pullbacks in uptrending markets as buying opportunities, we only use counter-trend bounces in downtrending markets as short selling opportunities.
Nevertheless, some of our subscribers who actively trade the markets on a very short-term basis may not have a problem with buying ETFs or stocks they may only be able to hold for a a few days (or possibly less). If this is you, iShares Xinhua China 25 Index ($FXI) is an ETF to consider buying, as it is one of the few non-inverse ETFs currently setting up for a relatively low-risk buy entry. The daily chart pattern is shown of FXI is shown below:

We initially pointed out the relative strength of FXI on November 14. In that day’s ETF trading commentary, we said, “Although the main stock market indexes of the USA have been in a downtrend since mid-September, FXI actually started trending higher right as the domestic markets started selling off…and is now in pullback mode.” At that time, FXI had just pulled back to major support of its 200-day moving average. One day later, it “undercut” both its 200-day MA and horizontal price support, then followed up with a bullish hammer that immediately took the price back above that break of support on November 16. As such, very short-term traders only might consider buying FXI if it moves above the November 16 high of $35.88.
If FXI is bought, keeping a tight protective stop is crucial for controlling risk because the main stock market indexes clearly remain in a confirmed downtrend. At worst, an initial stop should be placed no looser than just below the intraday low of the reversal day (November 16). If FXI provides the anticipated pop for a few days, be sure to trail a tight stop along the way to protect any profits. On quick trades like this, using the 20-period exponential moving average on the hourly chart interval often works well as a gauge of support to trail a stop. To reiterate, this setup is NOT on our “official” ETF Watchlist because it goes against the trend following rule based on our preferred time interval of swing trading.
Assuming stocks manage at least a few days of upside follow-through from last Friday’s bullish reversal patterns, new short selling opportunities should start developing, as well as potential re-entry points on recent winning swing trades we recently closed. An example of this would be if ProShares UltraShort Basic Materials ($SMN) or ProShares UltraShort Real Estate ($SRS) pulled back to new support of its 20-day exponential moving average. We also continue monitoring both iShares Nasdaq Biotech Index ($IBB) and QQQ for proper trade setups and signals to sell short.
As always, we will alert you of any new “official” entries to our ETF Watchlist in the coming days. In the meantime, enjoy the fact that we locked in a solid round of profits as the market has plunged lower over the past several weeks, which now gives us the mental luxury to calmly sit in a full 100% cash position while waiting for the market to bounce. Patience to wait for proper trade setups (avoiding overtrading) is one of the most common qualities among consistently successful stock traders.
stock commentary:
We closed out short positions in $SBUX ($418 gain) and $COH ($334 gain) on Friday at the open. After Friday’s bullish closing action in the averages, it looks as if we may have covered these positions at the right time. In the past we probably would have held on to $COH hoping for more downside, but we have learned it’s better to cover shorts into weakness and lock in profits, rather than sit through a potential reversal (when market is extended to downside).
The good news is that we were able to lock in some profits on the short side in ETFs and stocks last week. The bad news is that we now have to deal with a fractured market heading in to the big holiday season. Realistically, after this holiday shortened week we will have three more weeks of normal trading before the end of the year, as trading operations begin to slow down in mid-December and total volume drops off making it difficult for stocks to trend.
Price and volume action is king. However, we do have a few indicators we monitor to aid us in the process of identifying a market bottom. One simple indicator is the number of stocks that are trading below the 40-day moving average. Since 2009, every significant pullback in the market has dipped to the 10-20% level before reversing. Last week the number of stocks below the 40-day moving average in the market dipped to 16%, so we are in deeply oversold territory and know there is enough negativity out there to create a bottom. To be clear, this doesn’t mean that the market has bottomed out and we could certainly dip lower after a short-term bounce.

We will probably lay low this week unless we can find a solid, low risk setup on the short side. Once again, patience is key as we must wait for our pitch.
If you are a new subscriber, please e-mail [email protected] with any questions regarding our trading strategy, money management, or how to make the most out of this report.
relative strength combo watch list:
Our Relative Strength Combo Watchlist makes it easy for subscribers to import data into their own scanning software, such as Tradestation, Interactive Brokers, and TC2000. This list is comprised of the strongest stocks (technically and fundamentally) in the market over the past six to 12 months. The scan is updated every Sunday, and this week’s RS Combo Watchlist can be downloaded by logging in to the Members Area of our web site.