market timing model:
Neutral – Signal generated on the close of December 13 (click here for more details)
today’s watchlist (potential trade entries):

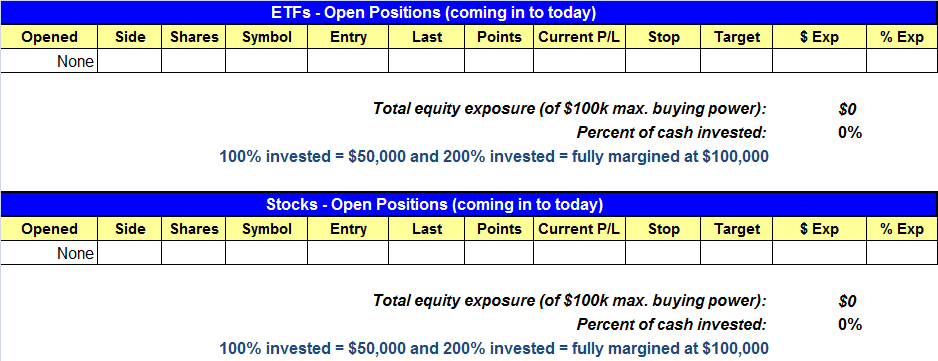
Having trouble seeing the open positions graphic above? Click here to view it directly on your web browser instead.
open positions:
Below is an overview of all open positions, as well as a report on all positions that were closed only since the previous day’s newsletter. Net P/L figures are based on two separate $50,000 model portfolios (one for ETFs and one for stocks). Changes to open positions since the previous report are listed in pink shaded cells below. Be sure to read the Wagner Daily subscriber guide for important, automatic rules on trade entries and exits.
Having trouble seeing the open positions graphic above? Click here to view it directly on your web browser instead.
closed positions:

Having trouble seeing the closed positions graphic above? Click here to view it directly on your web browser instead.
ETF position notes:
- Note changes to the $IBB setup.
stock position notes:
- No trades were made.
ETF and broad market commentary:
After rallying in the first half of the week, the main stock market indexes concluded the week on a dour note. Stocks gapped lower on last Friday’s open, oscillated in a tight, sideways range until the final 90 minutes of trading, then slipped to new intraday lows. The S&P 500 and Dow Jones Industrial Average declined just 0.4% and 0.3% respectively, but the Nasdaq Composite fell 0.7%. The index was once again dragged down by Apple ($AAPL), which fell 3.8% on the day, closed at its lowest level since February of this year, and carries roughly a 9% weighting in the tech-heavy Nasdaq. Lighter volume across the board enabled both the S&P 500 and Nasdaq to dodge what could have been another “distribution day.” Nevertheless, all the major indices finished at their lowest levels of the week.
In our December 14 commentary, we presented an annotated chart of S&P 500 SPDR ($SPY) and said, “Notice that $SPY will likely print a bearish shooting star candlestick pattern for the week. This is a topping pattern that often indicates near-term bullish momentum is running out.” Given that stocks printed another day of losses last Friday, that is exactly what happened. Furthermore, the rest of the broad-based indexes formed the same pattern on their weekly charts as well. This technically positions the broad market to be under additional selling pressure in the upcoming week ahead of the Christmas holiday.
In addition to highlighting the weekly chart of $SPY in last Friday’s newsletter, we also pointed out the bearish pattern and relative weakness in PowerShares QQQ Trust ($QQQ), a popular ETF for trading the Nasdaq 100 Index. On the updated daily chart below, notice that $QQQ is now trading below its 20, 50, and 200-day moving averages, each of which should now act as resistance on any bounce attempt. The blue horizontal line marks horizontal price support of the recent “swing lows” set earlier this month:

As marked by the brown, downward facing arrows, we anticipate that a break of horizontal price support in $QQQ will swiftly lead to a retest of the prior low from mid-November. Why? The reason is simply that the stock market rally off the mid-November lows has technically been nothing more than a countertrend bounce from near-term “oversold” conditions. Now, it looks as though the rally may have already run its course, as QQQ is now running into major resistance of its downtrend line from the September 2012 high. Below is a second daily chart of $QQQ, which clearly illustrates how the ETF ran into resistance of its multi-month downtrend last week (the red descending line):

We recently profited in a few ETF and stock swing trades on the long side after our market timing model shifted to “buy” mode, but at the time, we were still fully aware that the rally off the lows had not yet proven itself to be anything more than a countertrend bounce within the dominant downtrend. This is one of the several reasonsour market timing system shifted from “buy” to “neutral” mode on December 13, after several major indices formed “shooting stars” on their weekly charts after running into their dominant downtrend lines. Furthermore, if further selling pressure in the broad market persists and we receive the necessary signals, the timing model may soon revert back to “sell” mode. We locked in solid profits on the short side of the market (and through inversely correlated “short ETFs”) when the timing model was formerly in “sell” mode throughout most of October and part of November.
Going into today, we have officially added ProShares UltraShort QQQ ($QID) to our ETF Watchlist as a potential buy entry. This is an inversely correlated ETF that tracks the price action of $QQQ, but in the opposite direction. We are looking to buy $QID, rather than sell short $QQQ, because traders with non-marginable cash accounts are unable to initiate short positions, but are not restricted from buying “short ETFs” such as $QID. Also, even though it is a leveraged “short ETF,” $QID has shown only fractional underperformance to its underlying index for short-term trading.
Our short setup in iShares Nasdaq Biotechnology Index ($IBB) did not trigger for short sale entry last Friday, but remains on our watchlist going into today (note the adjusted trigger price). In the case of both $QQQ and $IBB, notice that we are looking for short entry on a bounce that retraces a portion of last Friday’s intraday range, rather than selling short a breakdown below an obvious level of price support. If you are new to our ETF and stock short selling strategy, this blog article and this video gives you a good primer as to how we prefer to enter new short positions.
As for the long side of the market, many international ETFs continue to show clear relative strength and bullish price divergence to the US markets. A handful of these ETFs even closed at fresh 52-week highs last Friday. We recently profited from the sale of two ETF swing trades on the long side of the market, $FXI (China) and $EPOL (Poland), and we continue to monitor select international ETFs for potential buy entry on a pullback. When emerging markets ETFs start forming price retracements that present positive reward to risk ratios for buy entry, we will highlight and bring to your attention some of the better-looking charts for possible buy entry. But other than international ETFs, there are practically no industry sector or other domestic ETFs on the long side of the market to get excited about.
stock commentary:
With the timing model in neutral, we do not have a clear signal in any direction and do not expect much to change with only two weeks of trading left in 2012. Our internal watchlist is about 20 deep on the long side and maybe half that on the short side.
Potential shorts we are watching that may or may not be actionable this week are: $VRSN, $TSCO, $BIDU, $ALXN, $BIDU, $ESRX, $YUM and $LVS.
Potential longs: $HOV, $LPX, $CVLT, $KKD, $LNKD, $CX, $RMD, $FAF, $MTZ, $GILD, $VAC, $RAX, $DK, $VMC, $HSNI and $CVI.
We are taking our foot off the gas on the long side due to the lack of follow through in buys (and breakouts we did not buy) over the past several weeks. If the market is going to stage a significant rally, then missing the first few stocks that break out won’t be such a big deal, as there will be plenty more. On the short side, For now we must continue to remain patient and wait for clear setups to emerge.
If you are a new subscriber, please e-mail [email protected] with any questions regarding our trading strategy, money management, or how to make the most out of this report.
relative strength combo watchlist:
Our Relative Strength Combo Watchlist makes it easy for subscribers to import data into their own scanning software, such as Tradestation, Interactive Brokers, and TC2000. This list is comprised of the strongest stocks (technically and fundamentally) in the market over the past six to 12 months. The scan is updated every Sunday, and this week’s RS Combo Watchlist can be downloaded by logging in to the Members Area of our web site.