market timing model:
Buy – Signal generated on the close of November 23
(click here for more details)
today’s watchlist (potential trade entries):

Having trouble seeing the open positions graphic above? Click here to view it directly on your web browser instead.
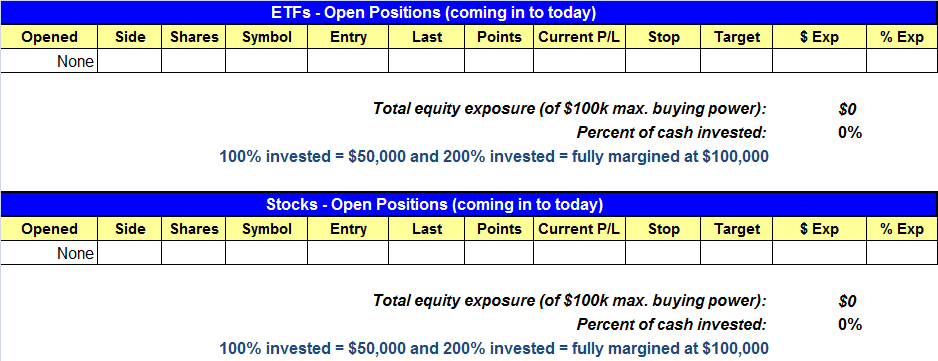
open positions:
Below is an overview of all open positions, as well as a report on all positions that were closed only since the previous day’s newsletter. Net P/L figures are based on two separate $50,000 model portfolios (one for ETFs and one for stocks). Changes to open positions since the previous report are listed in pink shaded cells below. Be sure to read the Wagner Daily subscriber guide for important, automatic rules on trade entries and exits.
Having trouble seeing the open positions graphic above? Click here to view it directly on your web browser instead.
closed positions:

Having trouble seeing the closed positions graphic above?
Click here to view it directly on your web browser instead.
ETF position notes:
- $IBB and $SMN were removed from the watchlist.
stock position notes:
- No trades were made.
ETF and broad market commentary:
Stocks finished the holiday-shortened week on a high note last Friday, as the S&P 500, Nasdaq, and Dow Jones each jumped an average of 1.34%. The small-cap Russell 2000 Index and S&P MidCap 400 indices showed a bit of relative weakness by gaining only 1.1% each. In a market that’s attempting to recover off the lows, it would have been better to see leadership among small and mid-cap stocks. Nevertheless, the broad market still scored a solid advance, especially considering that the exchanges closed three hours early on Friday.
Given the early closing time, total volume was not surprisingly lighter than the previous day’s turnover. HOWEVER, compared with the previous day’s volume as of 1:00 pm, overall volume levels actually ticked higher. Therefore, it’s fair to say that last Friday was actually an “accumulation day,” indicative of buying among banks, mutual funds, hedge funds, and other institutions.
It was obviously positive that stocks continued building on their gains since bouncing off their mid-November lows, and did so on higher volume last Friday. However, it’s still too early to declare an end of the broad market’s multi-month downtrend from its September 2012 highs. One of the biggest reasons we say this is because the main stock market indexes still have an abundance of overhead supply to contend with. Furthermore, several of the major indices are now bumping into, or are quickly approaching, key technical resistance levels. One good example of this can be seen on the daily chart pattern of PowerShares QQQ Trust ($QQQ), a popular ETF proxy for the Nasdaq 100 index:

As you can see, QQQ broke out above resistance of its 20 day exponential moving average last Friday. However, notice the horizontal price resistance just overhead, which was formed by the prior swing lows from late October, as well as the prior highs from July. Furthermore, the 200 day moving average, which formerly acted as support and now will provide formidable resistance, is less than 1% above the current price of QQQ. Above that resistance level is the 50 day moving average, which has been sloping lower since mid-October, and is in danger of crossing below the 200 day moving average.
We continue to monitor the Ishares Nasdaq Biotech ETF ($IBB) for a low risk entry point. Ideally we’d like to see one or two days of stalling action at or just above the 50-day moving average, which is less than 1% above Friday’s close. We also see the prior swing high from last July at about the same level as the 50-day MA.

$SMN and $IBB were removed from the official watchlist but we will continue to monitor the action for a potential low-risk entry point during the week. Although we are monitoring short setups, we can not ignore Friday’s accumulation day in the market. However, a market bottom is never a one day event for us, so we need to see more evidence build up over the next two weeks to confirm that an intermediate-term bottom is in place.
stock commentary:
The S&P 500 printed a bullish follow through day on Friday, shifting our timing model in to buy mode. NYSE volume was lower day over day, but when compared to the first 3.5 hours of trading on Thursday it was higher. The Nasdaq did not confirm the S&P, as total volume was lighter day over day and lighter when compared to Thursday’s volume at 1pm as well. However, the timing model needs only one major average to follow through to produce a buy signal.
As mentioned last week, a buy signal is generated by a powerful day of price and volume action, which can sometimes be manipulated. The questions to be answered this week are:
- Can the market avoid printing a bearish distribution day over the next 5 days
- Can new leadership stocks break out and hold on to their gains
When there is a buy signal after a significant correction we prefer to ease our way back in to the market and build on success. This means that we test the water with 2-3 small positions. If they work out….great, then we add more positions and increase our size. If these positions fail, then we take a step back and sit in cash or establish new positions (if setups are there) but with the same share size. This allows us to limit the damage in the portfolio when conditions are not ideal.
We are adding two new positions to the watchlist. Both setups are with reduced size, about 1/3 of full size, which is 20-25%.
If you are a new subscriber, please e-mail[email protected] with any questions regarding our trading strategy, money management, or how to make the most out of this report.
relative strength combo watchlist:
Our Relative Strength Combo Watchlist makes it easy for subscribers to import data into their own scanning software, such as Tradestation, Interactive Brokers, and TC2000. This list is comprised of the strongest stocks (technically and fundamentally) in the market over the past six to 12 months. The scan is updated every Sunday, and this week’s RS Combo Watchlist can be downloaded by logging in to the Members Area of our web site.