today’s watchlist (potential trade entries):

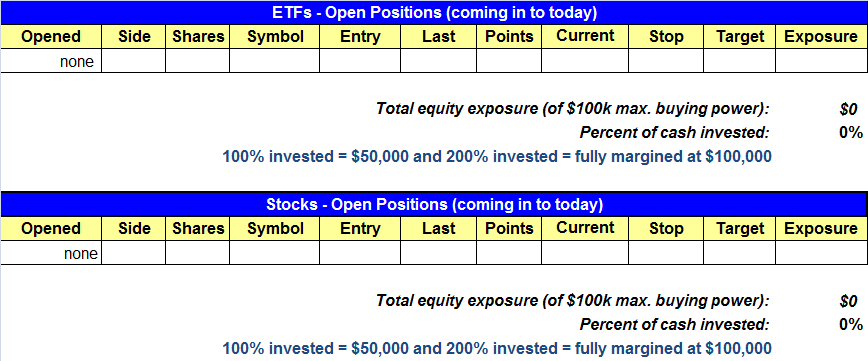
open positions:
Below is an overview of all open positions, as well as a report on all positions that were closed only since the previous day’s newsletter. Net P/L figures are based on two separate $50,000 model portfolios (one for ETFs and one for stocks). Changes to open positions since the previous report are listed in a pink shaded cell below. New entries are shaded in green cells. Be sure to read the Wagner Daily subscriber guide for important, automatic rules on trade entries and exits.

Having trouble seeing the open positions graphic above? Click here to view it directly on your web browser instead.
closed positions:

Having trouble seeing the closed positions graphic above? Click here to view it directly on your web browser instead.
ETF position notes:
- Sold EEV in to strength to lock in a solid + $400 gain.
stock position notes:
- No trades were made.
ETF and broad market commentary:
Equities closed lower on higher volume yesterday, but well off session lows. The major indices all gapped down at the open, undercut the April 23rd lows and reversed to close near session highs. In recent newsletters, we had stated that this exact price action had a reasonable likelihood of occurring. The small-cap Russell 2000 made the biggest comeback yesterday, as it nearly erased all of the day’s losses. The Russell ended the session lower by 0.1%. The S&P MidCap 400 lost 0.2% while the S&P 500 and the Nasdaq both slid 0.4%. The Nasdaq lost 0.6%.
Market internals ended the day mixed. Volume surged on the Nasdaq by 24% and on the NYSE by 20%. However, declining volume outpaced advancing volume on the Nasdaq by a ratio of 2.2 to 1 and on the NYSE by a factor of 2.8 to 1. Although declining volume was higher than advancing volume, the gap between the two narrowed throughout the day. Further, the sharp intraday price reversal accompanied by significantly higher volume, points to institutional accumulation on both exchanges.
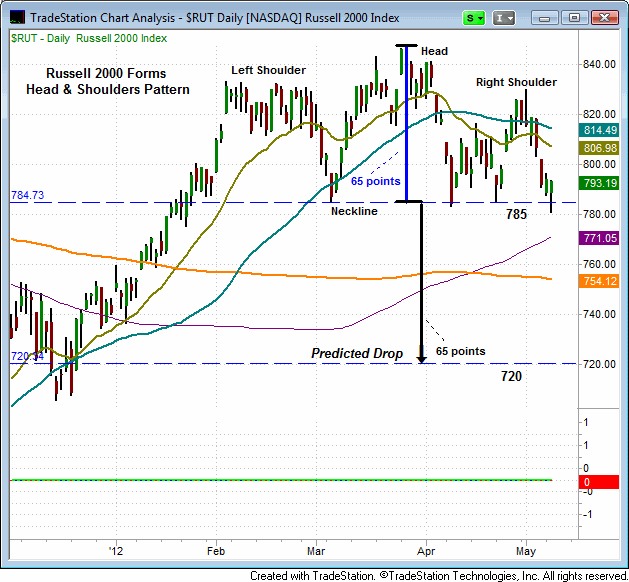
Since February of this year, the small-cap Russell 2000 has struggled to move to higher ground and has formed a Head and Shoulders like pattern. Head and Shoulders formations are considered a bearish reversal pattern (when an established uptrend is in place) and occur when price action in the market forms a technical pattern that visually looks like a human head and shoulders. In the chart of the small-cap Russell 2000 below, this pattern formation is quite evident. Notice the symmetry between the left and right shoulders. As of yesterday’s close, the right shoulder has been developing for 21 days and is now just three days shy of the 24 days it took the left shoulder to develop. Also notice the horizontal line labeled, “neckline”. This line represents the final level of support, which if breached, should result in a significant move lower in the index, stock, or ETF. Once support of the neckline is breached, the predicted decline in the index is the distance from the top of the head to the neckline (blue vertical line) projected downward (black vertical line). In this example, if the Russell 2000 loses support of the neckline at 785, then the predicted selloff would be to 720. We will be monitoring the Russell carefully, as its next test of the 785 mark could result in the loss of support and a significant move lower.

Yesterday, we sold our position in EEV as it hit its target yielding another substantial gain. Selling into strength allowed us to capture the lion’s share of the move in both SOXS and EEV. We are now completely out of the market. Although Tuesday marked an accumulation day for the Nasdaq and the NYSE, the market must still prove that it can hold yesterday’s lows and continue to show signs of institutional accumulation. However, yesterday was a good first step toward restoring market confidence.
stock commentary:
Based on the strong reversal action in the afternoon, the major averages are probably due for a short-term, relief bounce off the lows. At this point we wouldn’t expect much more than a bounce from deeply oversold levels, as the evidence does not point to the market being able to launch a sustainable rally at the moment. This could change in a week or two, but for now the market timing model sits on a sell signal and most stocks need at least a few weeks of rest to digest the recent damage.
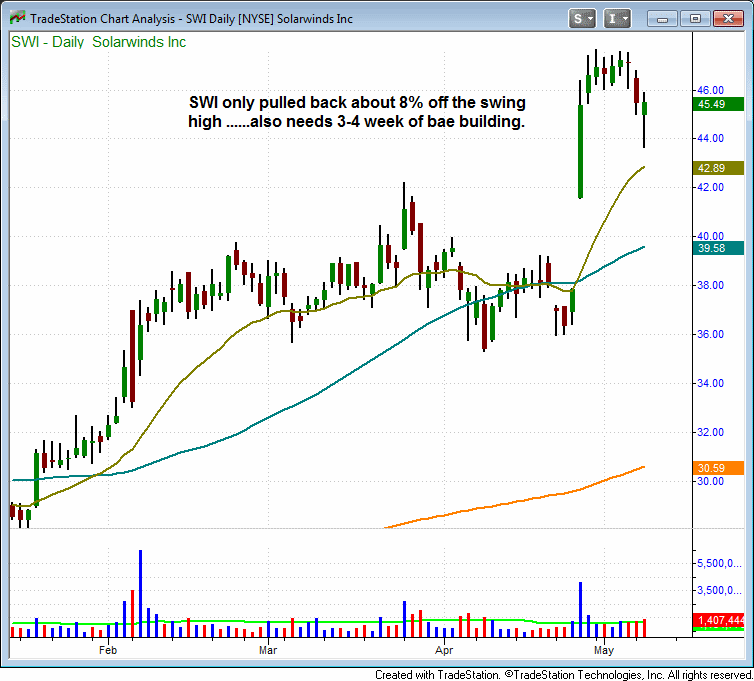
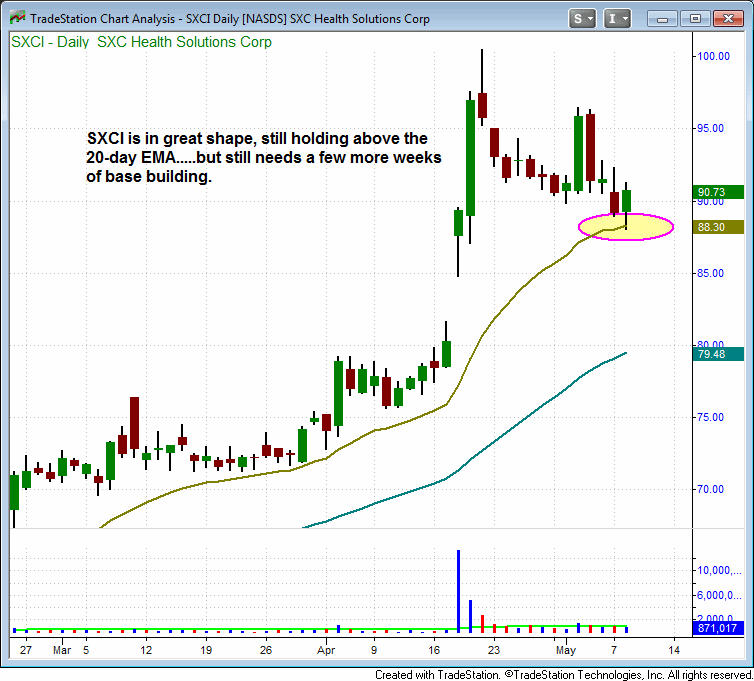
We are in the process of building a watchlist of stocks that held up the best during the selloff (these stocks must be at or near 52-week highs). For now I give you two examples of relative strength in SWI and SXCI. Both of these charts have held above the rising 20-day EMA and continue to set higher highs and lows the past few weeks (these setups are not official):


There is no change to short-term plan, which is to avoid trading for a few days. With the market in oversold territory we could easily see a quick two to three day reversal to the upside so it is a bit late to establish new short entries here. As for the long side, we are forced to lay low until market conditions improve.
If you are a new subscriber, please e-mail [email protected] with any questions regarding our trading strategy, money management, or how to make the most out of this report.