market timing model:
Buy – Signal generated on the close of November 23 (click here for more details)
today’s watchlist (potential trade entries):

Having trouble seeing the open positions graphic above? Click here to view it directly on your web browser instead.
open positions:
Below is an overview of all open positions, as well as a report on all positions that were closed only since the previous day’s newsletter. Net P/L figures are based on two separate $50,000 model portfolios (one for ETFs and one for stocks). Changes to open positions since the previous report are listed in pink shaded cells below. Be sure to read the Wagner Daily subscriber guide for important, automatic rules on trade entries and exits.
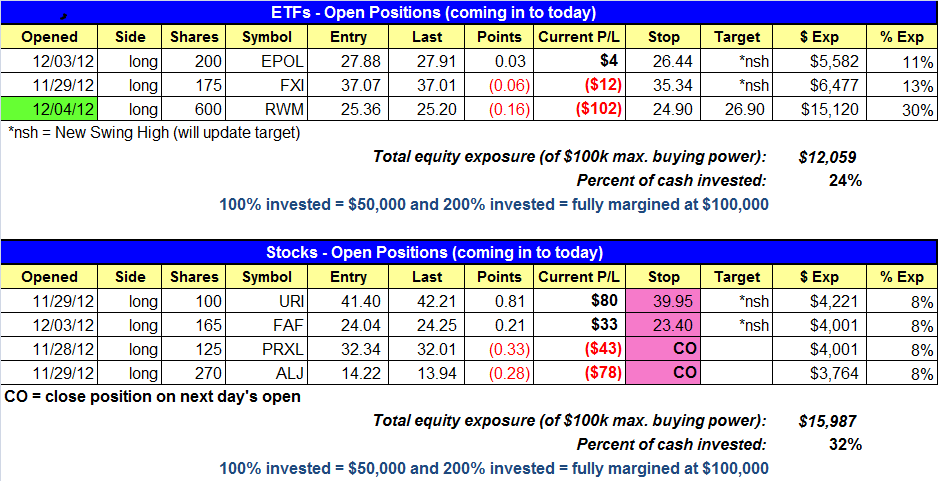
Having trouble seeing the open positions graphic above? Click here to view it directly on your web browser instead.
closed positions:
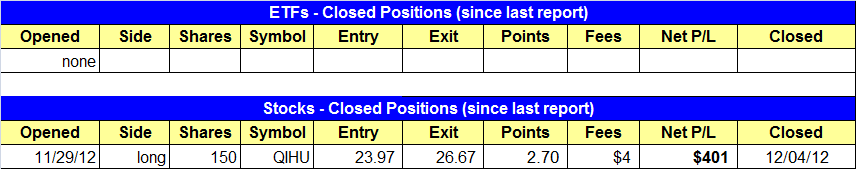
Having trouble seeing the closed positions graphic above? Click here to view it directly on your web browser instead.
ETF position notes:
- $RWM buy entry triggered.
stock position notes:
- $QIHU sell stop triggered, locking in a $400 gain.
ETF and broad market commentary:
Stocks sold off on higher volume Tuesday, but the losses in the major averages were not significant enough at less than 0.2% across the board to label the session as distribution. That being said, the market is showing signs of weakness at significant resistance levels, so we could see the averages continue to slide lower the next few days.
With the major averages stalling at resistance, our scans have produced a few quality short setups. We established a short position yesterday in the Russell 2000 by going long the Proshares Short Russell 2000 ($RWM). For those who missed yesterday’s entry, a slightly higher entry can be had on a move above Tuesday’s high (reduce share size to keep trade risk the same). We have one new setup on today’s watchlist in $IBB.
In the November 19 issue of the Wagner Daily, we discussed a potential head and shoulders topping pattern forming in the iShares Nasdaq Biotechnology ETF ($IBB). Click on the following link to learn more about a “head and shoulders” chart pattern. After a month long rally off the 200-day moving average, $IBB looks to have formed the right shoulder after stalling out at the 50-day MA the past few days. On the weekly chart below, notice how the recent price action stalled out around the high of the left shoulder. Quality head and shoulders patterns should form with a right shoulder that is equal to or less than the high of the left shoulder. A head and shoulder pattern for us in no longer valid once the right shoulder extends much beyond the left shoulder high.

On the daily chart below, notice how the volume is the heaviest on the decline from the top of the head to the bottom of the right shoulder. Higher volume on the selloff is what we look for to confirm the pattern. The past few days of stalling action just above the 50-day MA provides us with a low-risk entry point beneath yesterday’s low, which coincides with a break of the 50-day MA.

Despite the market closing down on higher volume, $EPOL managed to close up on the day and right at the highs of its three-month base. While $EPOL may not be able to hold a breakout attempt if the market pulls back in for a few days, given its relative strength it should be able to run to news highs when the market settles down, provided that our timing model remains on a buy signal. Our second long position in $FXI is holding up well and should be in good shape as long as it continues to set higher lows above the rising 50-day MA.
We mentioned earlier that the market was showing signs of weakness, and one major concern is the lack of explosive price action in leadership stocks. When analyzing the market, if we were to focus only on the charts of the major averages we would be missing a big piece of the puzzle which is market leadership. When our timing model shifts to buy mode after a significant correction, our attention always turns to leadership stocks and how they break out from valid basing patterns. Do they break out on strong volume and hold up or do they break out and selloff (false breakout)? This information is critical to our decision making. If leadership is strong, then we can increase our long exposure as well as our share size. If leadership is weak and the market suffers a few distribution days over a short period of time, then we reduce long exposure and look for potential short setups.
stock commentary:
$QIHU hit our tight stop and we are out with a decent $400 gain on an 11% move. Aside from QIHU, we haven’t had much to get excited about as the majority of our buy setups have failed to extend much beyond the trigger point. If 4 out 5 positions ran higher and we were up about 5-15% on each, then our confidence level would be pretty high, but that is not the case. However, our scans continue to show plenty of solid buy candidates, but the market may need a few more weeks before it is ready to launch higher.
We are playing it tight with current positions, as we raised the stop in $URI and $FAF and plan on closing $ALJ and $PRXL on the open. Tuesday’s reversal candle in $URI allows us to raise the stop without choking the position off. With $FAF, our stop is just beneath the two-day low, as we want this breakout to hold. As for $ALJ and $PRXL, there is just too much stalling action to stick with these positions, so we are getting out while we can to preserve cash. We do not mind playing it tight when conditions are not ideal, as we can always re-enter the market provided there are quality setups to trade. There is no need to force the issue.
If you are a new subscriber, please e-mail [email protected] with any questions regarding our trading strategy, money management, or how to make the most out of this report.
relative strength combo watchlist:
Our Relative Strength Combo Watchlist makes it easy for subscribers to import data into their own scanning software, such as Tradestation, Interactive Brokers, and TC2000. This list is comprised of the strongest stocks (technically and fundamentally) in the market over the past six to 12 months. The scan is updated every Sunday, and this week’s RS Combo Watchlist can be downloaded by logging in to the Members Area of our web site.