Commentary:
The price action leading up to the Wednesday’s Fed announcement was rather dull, with the broad market averages selling off a bit in the morning session before leveling out in the early afternoon. As expected, the volatility really picked up after the report, with all the major averages reversing more than 1% off the session lows. The late rally pushed the averages into positive territory, closing near the highs of the day. The S&P 500 gained 0.4%. The small-cap Russell 2000 and Nasdaq Composite both closed up 0.3%. The Dow Jones Industrial Average and S&P MidCap 400 both edged out a 0.2% gain.
Turnover ran higher on both exchanges, which is typical of a Fed day. NYSE volume jumped 23%, while Nasdaq volume posted a 3% gain. Although yesterday’s price and volume action was bullish, keep in mind that the real reaction to the Fed usually comes one to two days after the meeting.
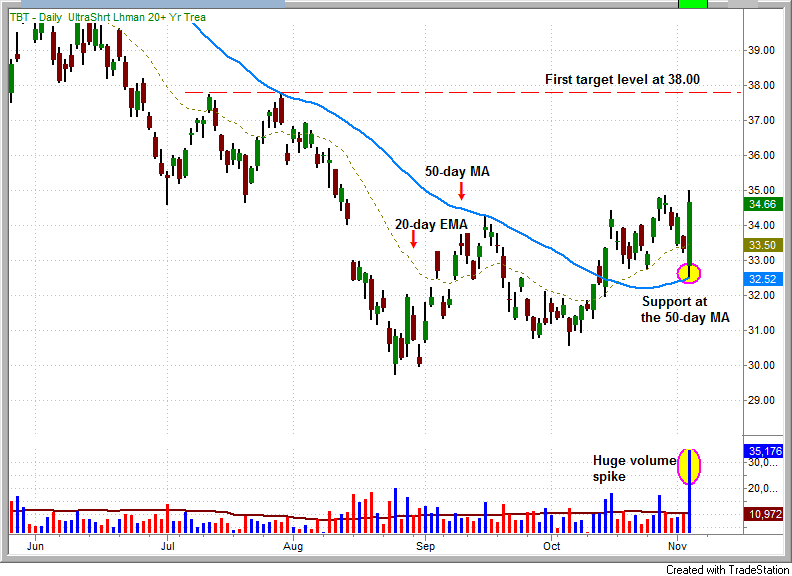
Our ProShares UltraShort 20+Year Treasury (TBT) long position closed with a very bullish, gap down reversal bar yesterday. The big move off the 50-day moving average was accompanied by very heavy volume. We originally entered TBT on 10/14, at 33.35 as it was breaking above a four month downtrend line on higher volume (after setting a higher low on the daily chart). After a few weeks of choppy action, it looks as though TBT will finally confirm the downtrend line break with a clear move above 35.00. Aside from the strong price action, we now have a few technical clues in our favor for a potential trend reversal. The 50-day moving average is beginning to slope higher over the past few days. We also have a bullish moving average crossover with the 20-day EMA crossing above the 50-day MA on 10/18.
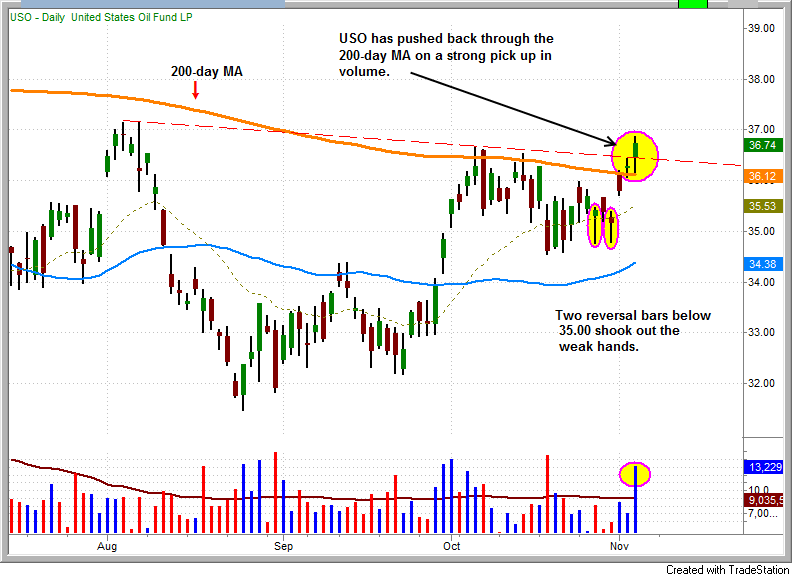
Our long position in United States Oil Fund (USO) also logged a solid day of gains, as it broke through the 200-day moving average on higher than average volume. Like TBT, our USO long had been chopping the past few weeks since our entry point at 36.09 on 10/13. The 200-day moving average should provide support on any pullback over the next few days.
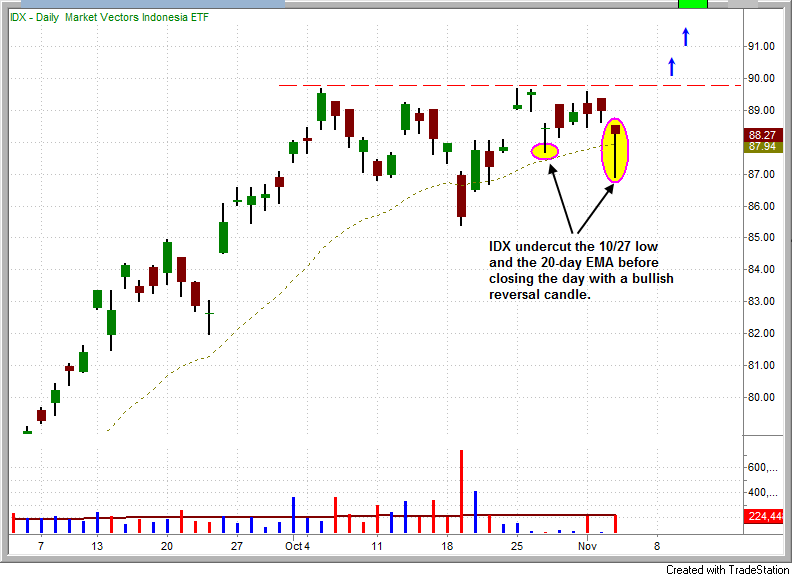
Market Vectors Indonesia (IDX) has been consolidating in a very tight range near the 52-weeks high over the past several weeks. The price action has held above the 20-day EMA with the exception of a few a few bullish shakeouts. The most recent shakeout produced a bullish reversal bar yesterday, as the price action dipped below the prior low of 10/27 and the 20-day EMA before closing near the highs of the day. IDX is a potential swing entry buy over yesterday’s high with partial size. One could look to add to the position on a breakout above 89.80.
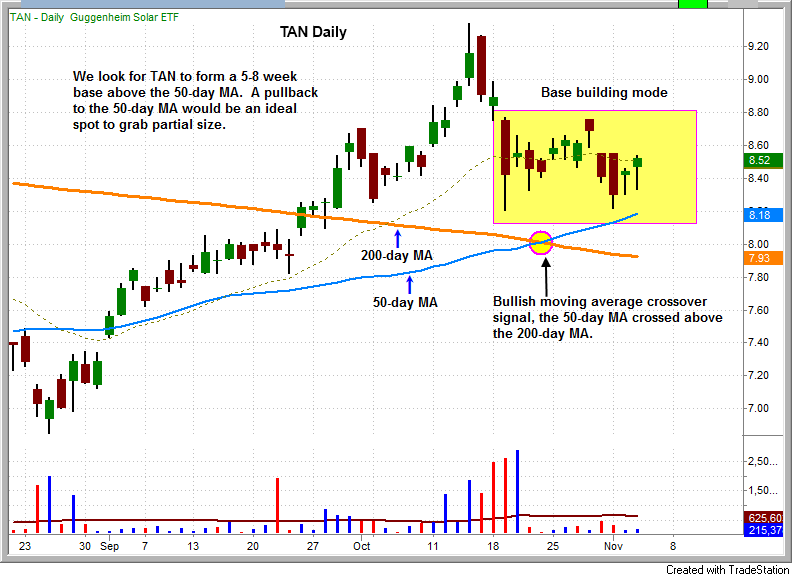
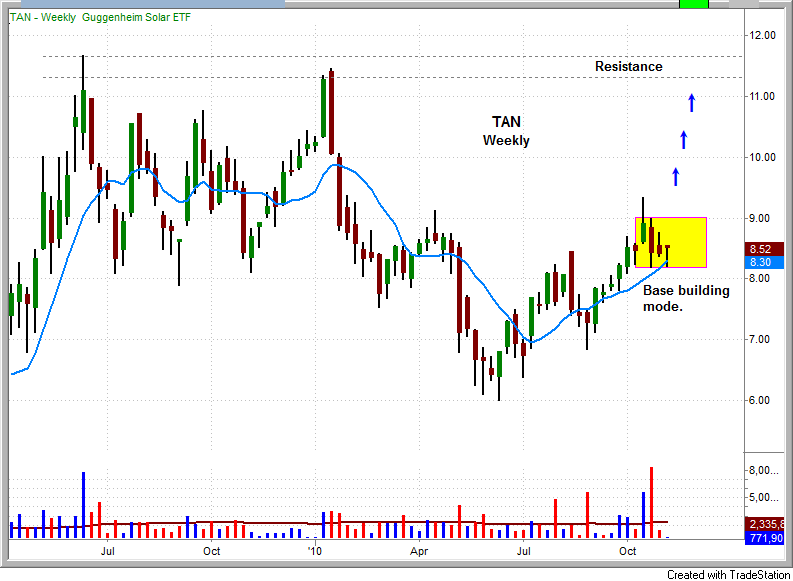
Guggenheim Solar (TAN) has finally entered pullback mode after rallying about 35% off the August low. We look for TAN to form a tight, five to eight week base above its 50-day moving average. Any pullback into the 50-day MA should provide a low-risk buy point for partial size. The 50-day moving average has crossed above the 200-day moving average, which suggests that the price action is setting up for a potential long-term trend reversal. The bottom chart below shows the trade potential on the next wave up. If TAN can breakout from a bullish base, it could run about 25% higher before hitting resistance of the prior highs around 11.00.
Today’s Watchlist:
There are no new official setups for today. As always, we will promptly send an Intraday Alert if any new trades are made.
Daily Performance Report:
Below is an overview of all open positions, as well as a performance report on all positions that were closed only since the previous day’s newsletter. Net P/L figures are based on the $50,000 Wagner Daily model account size. Changes to open positions since the previous report are listed in red text below. Please review the Wagner Daily Subscriber Guide for important, automatic rules on trigger and stop prices
IWC triggered per yesterday’s official setup.
- Reminder to subscribers – Intraday Trade Alerts to your e-mail and/or mobile phone are normally only sent to indicate a CHANGE to the pre-market plan that is detailed in each morning’s Wagner Daily. We sometimes send a courtesy alert just to confirm action that was already detailed in the pre-market newsletter, but this is not always the case. If no alert is received to the contrary, one should always assume we’re honoring all stops and trigger prices listed in each morning’s Wagner Daily. But whenever CHANGES to the pre-market stops or trigger prices are necessary, alerts are sent on an AS-NEEDED basis. Just a reminder of the purpose of Intraday Trade Alerts.
- For those of you whose ISPs occasionally deliver your e-mail with a delay, make sure you’re signed up to receive our free text message alerts sent to your mobile phone. This provides a great way to have redundancy on all Intraday Trade Alerts. Send your request to [email protected] if not already set up for this value-added feature we provide to subscribers.

Having trouble seeing the position summary graphic above?
Click here to view it directly on your Internet browser instead.
Notes:
Edited by Deron Wagner,
MTG Founder and
Head Trader