market timing model:
Confirmed Buy – Signal generated on the close of September 4 (click here for more details) (we are on a buy signal from the close of Aug. 16)
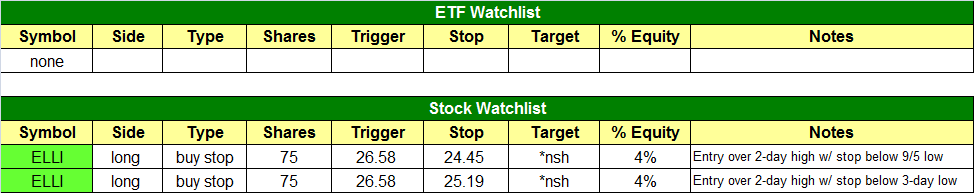
today’s watchlist (potential trade entries):
Having trouble seeing the open positions graphic above? Click here to view it directly on your web browser instead.
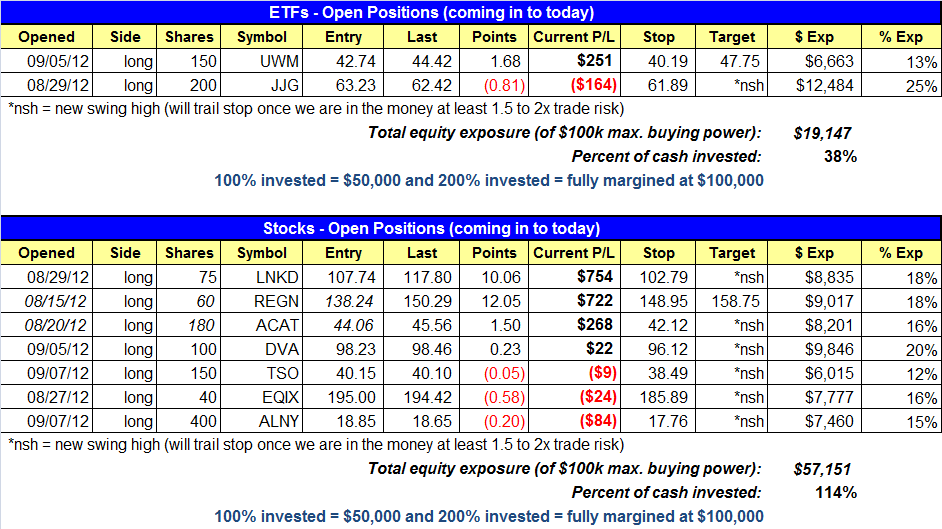
open positions:
Below is an overview of all open positions, as well as a report on all positions that were closed only since the previous day’s newsletter. Net P/L figures are based on two separate $50,000 model portfolios (one for ETFs and one for stocks). Changes to open positions since the previous report are listed in pink shaded cells below. Be sure to read the Wagner Daily subscriber guide for important, automatic rules on trade entries and exits.
Having trouble seeing the open positions graphic above? Click here to view it directly on your web browser instead.
closed positions:

Having trouble seeing the closed positions graphic above? Click here to view it directly on your web browser instead.
ETF position notes:
- No trades were made.
stock position notes:
- No trades were made. ELLI is listed twice due to the split stop.
ETF and broad market commentary:
After an impressive rally in the latter half of last week, stocks pulled back a bit yesterday, but did so on lighter volume. The Dow Jones Industrial Average ($DJIA) eased 0.4%, the S&P 500 Index slipped 0.6%, and the Nasdaq Composite lost 1.0%. The small-cap Russell 2000 Index ($RUT) and S&P MidCap 400 Index ($MID) declined 0.3% and 0.4% respectively. All the major indices finished at their intraday lows.
Despite yesterday’s losses, it was positive that the decline occurred on decreasing volume across the board. Total volume in the NYSE was 13% lighter than the previous day’s level, while volume in the Nasdaq decreased 9%. In both exchanges, declining volume exceeded advancing volume by a ratio of approximately 2 to 1, which was not overly bad. The fact that yesterday’s selloff was on lighter volume is important because it tells us there was a lack of heavy selling among banks, mutual funds, hedge funds, and other institutions. It is obviously normal for uptrending markets to retrace and catch their breath along the way, and lighter volume declines indicate the bulls were taking a rest, rather than the bears taking control.
We did a lot of scanning for new, low-risk ETF swing trade setups after the close, and frankly there was not much to be found. Most of the strongest ETFs, such as iShares Nasdaq Biotechnology Index ($IBB), which we just sold for a nice gain last week, have begun to pull back from their highs, but not yet by enough of a margin to consider trade re-entry. If we see a few more days of sideways to declining price action in the broad market, it may create select buying opportunities, and we will be sure to alert you of such.
In uptrending markets, a vast majority of our ETF trade entries are Breakouts to new highs and Pullbacks to near-term support levels in strongly trending ETFs. However, we sometimes take advantage of Trend Reversal plays for quick, momentum-based “pops.” An example of this is our recent winning trade in DB Gold Double Long ($DGP), which we bought after it broke out above both its 200-day moving average and one-year downtrend line. Presently, another potential Trend Reversal play is setting up in iShares Hong Kong Index ($EWH).
Starting with the weekly chart, you will see that EWH is testing resistance of a downtrend line that has been in place since early 2011. It has also formed two “higher lows” since then, which are annotated on the chart below:

When buying Trend Reversals, we never try to catch the absolute bottom because it is risky and foolhardy. Rather, we prefer to see sufficient confirmation that a significant bottom has formed before attempting to buy. The two “higher lows” on the weekly chart above are positive because it indicates key bottoming action. However, it is also important to look for confirmation of intermediate-term trend reversal on the shorter-term daily chart interval. For this, we need to see that the 20-day, 50-day, and 200-day moving averages have all begun to slope higher. Finally, we need to ensure that the 20-MA is above the 50-MA, and the 50-MA is above the 200-MA. Typically, it takes at least several months from the absolute lows for these events to occur. In the case of EWH, it also meets our requirements on the daily chart. Take a look:

Because yesterday was the first day of price correction in the broad market since last week’s breakout, we are not yet listing EWH as an “official” trade setup on our watchlist today. Nevertheless, it is on our radar screen and we will report here in the newsletter if we decide to target EWH for new trade entry.
Although the Nasdaq Composite gave back a majority of last week’s breakout in yesterday’s decline, it’s notable that leading small-cap growth stocks (the Russell 2000) showed considerable relative strength. Along with the lighter volume that accompanied yesterday’s losses, it is a positive sign that small-cap stocks held on to most of their gains. For now, there is no technical indication that the market is poised for anything more than a normal, healthy correction off the highs. We are not concerned unless the market starts selling off on increasing volume and leading stocks start to falter.
stock commentary:
Although our main tool for market analysis is simply to scan a list of the strongest stocks each day and make sure the patterns remain bullish, we do have a few secondary indicators to confirm what we see in the charts. One such indicator is the New 52-Week Highs list. Just like we want to see stocks breaking out to new highs, we also want the number of New 52-Week highs to expand to confirm that breadth is improving. We clearly see that happening on the chart below of the S&P 400, where New 52-Week highs set a new high for the year.

New highs on the Russell 2000 have not broken out this year but the number is improving:

We added one new setup to today’s watchlist in ELLI, which is listed twice in the watchlist due to the split stop. We are reducing share size to just under half at 8% and will look to add to the position if ELLI can set a higher high and higher low.
If you are a new subscriber, please e-mail [email protected] with any questions regarding our trading strategy, money management, or how to make the most out of this report.
relative strength combo watchlist:
Our Relative Strength Combo Watchlist makes it easy for subscribers to import data into their own scanning software, such as Tradestation, Interactive Brokers, and TC2000. This list is comprised of the strongest stocks (technically and fundamentally) in the market over the past six to 12 months. The scan is updated every Sunday, and this week’s RS Combo Watchlist can be downloaded by logging in to the Members Area of our web site.