market timing model:
Buy – Signal generated on the close of December 31 (click here for more details)
today’s watchlist (potential trade entries):

Having trouble seeing the open positions graphic above? Click here to view it directly on your web browser instead.
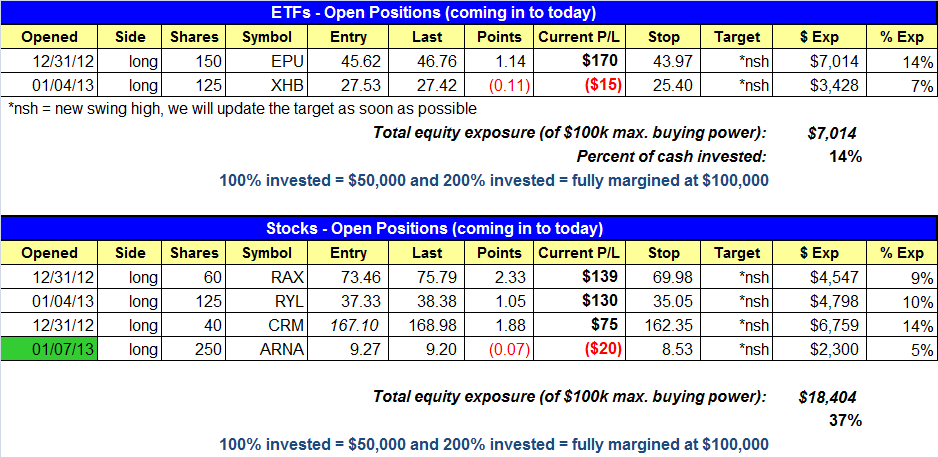
open positions:
Below is an overview of all open positions, as well as a report on all positions that were closed only since the previous day’s newsletter. Net P/L figures are based on two separate $50,000 model portfolios (one for ETFs and one for stocks). Changes to open positions since the previous report are listed in pink shaded cells below. Be sure to read the Wagner Daily subscriber guide for important, automatic rules on trade entries and exits.
Having trouble seeing the open positions graphic above? Click here to view it directly on your web browser instead.
closed positions:

Having trouble seeing the closed positions graphic above? Click here to view it directly on your web browser instead.
ETF position notes:
- No trades were made.
stock position notes:
- $ARNA buy entry triggered.
ETF, stock, and broad market commentary:
Broad market averages chopped around in negative territory for much of the day before reversing in the final 90 minutes of trading and closing near the highs of the session. Despite the late afternoon rally, the Nasdaq 100 was the only index to close in positive territory. However, losses were minimal across the board, with the biggest loss of the day coming from the Dow and small-cap Russell 2000 both at -0.38%. As long as the market continues to chop around on light volume we view the action as bullish.
Earlier in the day, with the market in negative territory total volume was running slightly higher and on pace for a potential distribution day. However, the price action recovered late in the day and total volume slowed in the afternoon with NYSE volume falling off by 4% and Nasdaq volume off by 3%. As we have mentioned the past few days, we continue to see a bullish volume pattern in the market.
In yesterday’s (January 7) technical ETF trading commentary of The Wagner Daily newsletter, we mentioned the possibility of a Pullback swing trade buy entry developing in the WisdomTree India Earnings Fund ($EPI) during the next few days. As we were anticipating, $EPI indeed pulled back for the third day in a row yesterday, and did so on lighter than average volume (which is positive).
On the hourly (60-minute) chart interval (which is not shown below), $EPI has just retraced to “undercut” its 20-period exponential moving average (20-EMA), which usually provides near-term support in strong breakouts. The ideal Pullback Buy Setup is at least 3 to 7 days in length (retracement from the high), with volume declining on the pullback, and orderly price action along the way. So far, this setup meets our criteria for pullback entry.
Although we’d love to see $EPI pull back closer to the prior breakout level at $19.40 in order to establish an even lower risk position, we do not want to miss the next potential move higher when the bullish momentum of the recent breakout resumes. As such, we have placed $EPI on our official ETF Trading watchlist as a possible buy entry today. The technical trading setup of $EPI is shown on the daily chart below:

Although there is a decent likelihood $EPI will meet our criteria for buy trigger today, it may still pull back for one more day before attempting to resume the bullish momentum of its recent breakout. If that happens, we may be able to establish a lower-risk buy entry point tomorrow (January 9).
Along with $EPI and $EWS (discussed in yesterday’s newsletter), the iShares MSCI Taiwan Index ($EWT) is another international (Asian) ETF trade setup we are adding to today’s “official” watchlist as a potential ETF swing trade entry. As you can see below, the daily chart of $EWT shows the bullish basing action that has formed since the 50-day moving average (50-MA) crossed back above the 200-day moving average in September. For bullish chart patterns, we are always looking for the price action to tighten up within a base of consolidation, and we are now seeing that with the price action finding support at the 50-MA in late December, and potentially finding support at the 20-day EMA this week.
If the price action holds the 20-EMA and triggers a swing trade buy entry, we may be able to add to the position on the way up (below $13.80) if there is some sort of one or two-day pause. If not, then we may have to add on a breakout above $13.80 or $14.00. As with the $EPI setup, subscribers should note our exact, preset trade details for the setup shown below.

On the stock side, $ARNA triggered our buy entry late in the day as the price action emerged a tight consolidation on the hourly chart. We have three new buy setups on today’s watchlist. The first setup is in $OCN, which broke out on convincing volume yesterday. We are looking for a slight pullback tomorrow, just to get our stop around 8% on the trade. We like the tight basing action around the 50-day MA. Also, $OCN’s relative strength ranking is 98 along with a 91 EPS rank. Its industry group rank is 4 our of 197.

$LL is a potential pullback entry with a very tight stop around 2.5%. If the stop triggers fine as we are not risking much. We can always re-enter the setup if we are shaken out. The last setup is in $LNKD, where we have two entry points with an average stop of about 5%.
If you are a new subscriber, please e-mail [email protected] with any questions regarding our trading strategy, money management, or how to make the most out of this report.
relative strength combo watchlist:
Our Relative Strength Combo Watchlist makes it easy for subscribers to import data into their own scanning software, such as Tradestation, Interactive Brokers, and TC2000. This list is comprised of the strongest stocks (technically and fundamentally) in the market over the past six to 12 months. The scan is updated every Sunday, and this week’s RS Combo Watchlist can be downloaded by logging in to the Members Area of our web site.