market timing model:
Neutral – Signal generated on the close of October 5 (click here for more details)
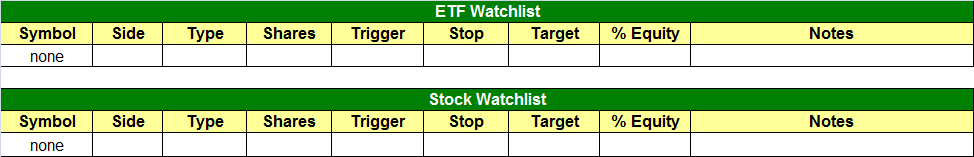
today’s watchlist (potential trade entries):
Having trouble seeing the open positions graphic above? Click here to view it directly on your web browser instead.
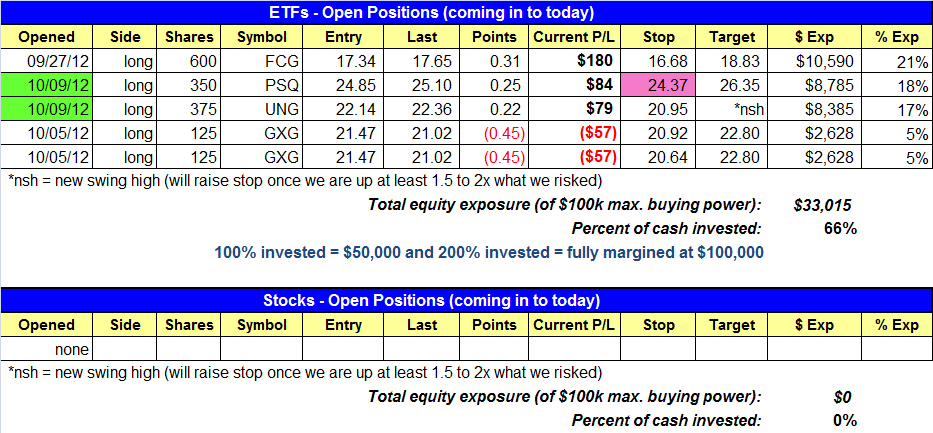
open positions:
Below is an overview of all open positions, as well as a report on all positions that were closed only since the previous day’s newsletter. Net P/L figures are based on two separate $50,000 model portfolios (one for ETFs and one for stocks). Changes to open positions since the previous report are listed in pink shaded cells below. Be sure to read the Wagner Daily subscriber guide for important, automatic rules on trade entries and exits.
Having trouble seeing the open positions graphic above? Click here to view it directly on your web browser instead.
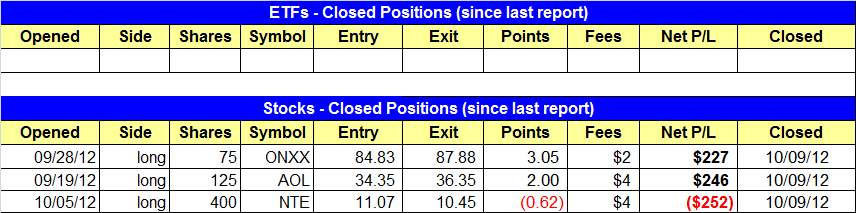
closed positions:
Having trouble seeing the closed positions graphic above? Click here to view it directly on your web browser instead.
ETF position notes:
- PSQ and UNG longs triggered.
stock position notes:
- ONXX and AOL hit their stops for small gains. NTE stopped us out as well with a smaller than average loss.
ETF and broad market commentary:
After getting off to a relatively flat start, stocks trended steadily lower throughout the first half of the day, drifted sideways throughout the afternoon, then edged to new intraday lows in the final hour of trading. All the major indices closed substantially lower. The Dow Jones Industrial Average ($DJIA) tumbled 0.8%, the S&P 500 Index ($SPX) 1.0%, and the Nasdaq Composite ($COMPX) 1.5%. With its sharp plunge, the Nasdaq became the first broad-based index to close below key intermediate-term support of its 50-day moving average. The small-cap Russell 2000 Index ($RUT) and S&P Midcap 400 Index ($MID) slid 1.3% and 1.0% respectively. Each of the main stock market indexes closed at its low of the day.
Yesterday’s selloff was confirmed by a sharp pickup in volume across the board. Total volume in the NYSE jumped 29%, while turnover in the Nasdaq surged 39% above the previous day’s level. Market internals were also firmly negative. In the NYSE, declining volume exceeded advancing volume by a margin of approximately 3 to 1. The Nasdaq ADV/DEC volume ratio was negative by nearly 7 to 1. This tells us the selling was broad-based, particularly within the Nasdaq. The higher volume losses in both exchanges caused both the S&P 500 and Nasdaq to suffer another “distribution day.” It was the fifth session of institutional selling in the Nasdaq in recent weeks, which is about the threshold that a healthy market uptrend can withstand before substantially correcting lower. The only potentially positive aspect of yesterday’s volume pattern was that trade in both the NYSE and Nasdaq remained below 50-day average levels, but this was only because turnover the previous day was the lightest we had seen since late August.
Despite the bearishness of yesterday’s session, our open ETF positions had a great day! Going into yesterday (October 9), we were already long both First Trust Natural Gas Index ($FCG) and a partial position of iShares Colombia Index ($GXG). FCG, whose portfolio of individual stocks often move in a similar direction to the price of natural gas futures, ignored the broad market weakness and rallied to a 1.2% gain. GXG, an international ETF with a relatively low correlation to the direction of the US stock market, edged just 0.2% lower. Additionally, both ETFs on our watchlist going into yesterday triggered for buy entry as well. Cruising 2.3% higher, the US Natural Gas Fund ($UNG) followed through on its bull flag pattern that we pointed out in the October 9 report. The other ETF that triggered for buy entry was ProShares Short QQQ ($PSQ), which inversely tracks the price of the Nasdaq 100 Index (recall our October 8 analysis of the bearish “head and shoulders” pattern that had formed on the index). As the Nasdaq 100 Index lost 1.6% and sliced below support of its 50-day moving average yesterday, PSQ conversely rallied 1.7% and broke out above resistance of its 50-day moving average. Putting the performance of all four ETF positions together, here was the individual scorecard for yesterday: +2.3%, +1.6%, +1.2%, and -0.2% (on a half-sized position). Obviously, that made for a pretty nice day considering the substantial losses in the broad market. In fact, it would have been a great day even if the main stock market indexes would have rallied yesterday.
The extreme outperformance of our ETF positions in yesterday’s weak market was a great example of the power of swing trading both ETFs and individual stocks in our Wagner Dailynewsletter. In strong, uptrending markets, such as what we had seen throughout August and the first half of September, individual stock positions will typically realize larger gains than our ETF positions due to the higher beta of small and mid-cap stocks that we commonly trade. However, when our market timing system shifts into “neutral” or “sell” mode, we immediately reduce both the number of trades and share size of individual stock positions, while increasing our focus on ETFs with a low correlation to the direction of the broad market (such as commodity, international, currency, and fixed income ETFs). Over the past 10 years that we have been writing The Wagner Daily newsletter, we have found the combination of trading both stocks and ETFs in our newsletter enables us to avert major losses, and even profit, when the overall stock market heads lower, while still being able to participate in generating steady gains in uptrending markets. The end result is a much smoother equity curve over the long-term (click here to see our performance page which demonstrates this).
As long as the market remains in correction mode, we are not interested in buying industry sector ETFs because most of them have a close correlation to the direction of the overall broad market. However, astute traders will be building a watchlist of ETFs that were exhibiting relative strength to the broad market before the pullback began, as these will likely be the first ETFs to surge back to their prior highs when the stock market stabilizes and finds substantial support. One such ETF to put on your watchlist is iShares Nasdaq Biotech Index ($IBB).
Presently trading just shy of its all-time high, IBB closed at near-term support of its 20-day exponential moving average yesterday. Since July of this year, that moving average has firmly acted as support, which led to a subsequent new high being formed each time the ETF headed back up. This means that IBB has not even touched substantial intermediate-term support of its 50-day moving average since its current uptrend began in mid-June of this year. In the coming weeks, we would like to see IBB retrace all the way down to its 50-day moving average because the first touch of the 50-day moving average after a multi-month uptrend typically presents a low-risk pullback buying opportunity with a very positive reward to risk ratio. The target for the pullback of IBB that we are monitoring is shown on the daily chart below:

Although our current open ETF positions are now looking pretty good, we must be cognizant of the fact that the main stock market indexes are now sitting in a kind of “no man’s land.” On one hand, both the Nasdaq Composite and Nasdaq 100 indices have firmly fallen below key intermediate-term support of their 50 – day moving averages. But on the other hand, the Dow Jones is still holding right at support of its 20-day exponential moving average and the S&P 500 only marginally closed below its 20-day exponential moving average. With such divergence in the broad market, we must be prepared for the fact that stocks could suddenly rip back up without notice. Therefore, our best plan of action right now is simply to focus on managing our existing open positions, rather than taking on additional risk exposure. This is simply in line with the current “neutral” mode of our market timing model, which went into effect at the close of trading on October 5.
stock commentary:
There are many ways to make money in this business. Some strategies are extremely complex and others are quite simple. We prefer the latter, especially when it is based on something that can never be ignored…..price action of stocks. Simply put, if there are no quality chart patterns to buy…then we do not buy. We can not get around this no matter what indicators we use. Let’s say about a month ago, our scans turned up 60-70 bullish chart patterns. From that list we narrowed it down to 20 that were ready for a buy entry within the next week or two. From that list we narrowed it down further to maybe 5-8 that could trigger the next day. Compare that to tonight or Monday night, where we found less than 5 stocks that were ready to trigger this week and maybe 1 or 2 that could trigger within the next day or two. That is a huge difference. Also, when we only have a few bullish patterns to trade our confidence level goes way down. A few weeks ago, I could fill a 10-15 slot portfolio if I wanted to in 2-3 days and quickly go on margin (with high quality setups). Based on current patterns, I couldn’t even come close to that number in two weeks. As always, conditions can change quickly but for now we are happy to be in cash.
There are no new setups for today. We remain 100% in cash on the long side after stopping out of existing positions yesterday. We were able to lock in small gains in ONXX and AOL, while limiting losses in ARRY, LNKD, and NTE. This is how we prefer to manage the portfolio when conditions turn sour. On setups that do not workout we try to get out at or around break-even….if we can. We already reduced our share size on new trades last week, so when we do let a trade slide all the way down to the stop as we did with NTE the full loss is only $250 (well below max loss). We are currently up about $490 (1%) this month, even though we stopped out of 5 trades and booked profits on 3. This is why limiting losses is so important when conditions deteriorate.
If you are a new subscriber, please e-mail [email protected] with any questions regarding our trading strategy, money management, or how to make the most out of this report.
relative strength combo watchlist:
Our Relative Strength Combo Watchlist makes it easy for subscribers to import data into their own scanning software, such as Tradestation, Interactive Brokers, and TC2000. This list is comprised of the strongest stocks (technically and fundamentally) in the market over the past six to 12 months. The scan is updated every Sunday, and this week’s RS Combo Watchlist can be downloaded bylogging in to the Members Area of our web site.