market timing model:
Sell – Signal generated on the close of October 12 (click here for more details)
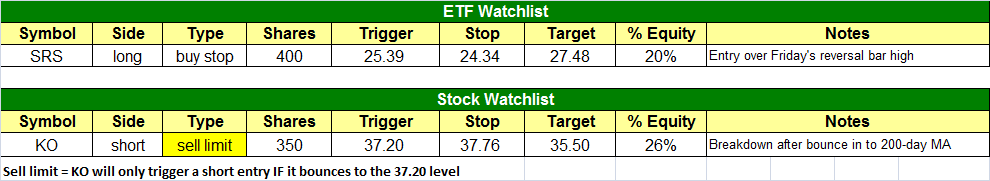
today’s watchlist (potential trade entries):
Having trouble seeing the open positions graphic above? Click here to view it directly on your web browser instead.
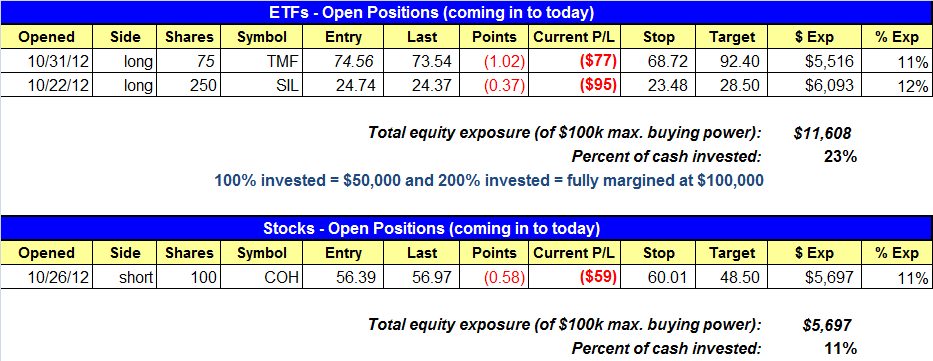
open positions:
Below is an overview of all open positions, as well as a report on all positions that were closed only since the previous day’s newsletter. Net P/L figures are based on two separate $50,000 model portfolios (one for ETFs and one for stocks). Changes to open positions since the previous report are listed in pink shaded cells below. Be sure to read the Wagner Daily subscriber guide for important, automatic rules on trade entries and exits.
Having trouble seeing the open positions graphic above? Click here to view it directly on your web browser instead.
closed positions:
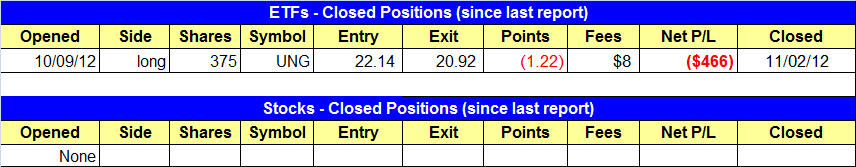
Having trouble seeing the closed positions graphic above? Click here to view it directly on your web browser instead.
ETF position notes:
- UNG stop triggered and we are out.
stock position notes:
- No trades were made.
ETF and broad market commentary:
In the November 2 issue of our Wagner Daily swing trader newsletter, we concluded our ETF trading commentary by saying, “Given the kind of weakness that we’ve seen lately, including continued relative weakness in key large-cap tech stocks like Apple ($AAPL), it would not be surprising if there is minimal upside follow-through on yesterday’s bounce.” Indeed, not only was there a lack of follow through to the upside, but stocks also gave back a majority of the previous day’s gains. The major indices gapped higher on the open, it is then quickly settled into a steady intraday downtrend that persisted into the close. The S&P 500 Index ($SPX) fell 0.9%, the Dow Jones Industrial Average ($DJIA) 1.1%, and the Nasdaq Composite ($COMPX) 1.3%. The small-cap Russell 2000 Index ($RUT) and S&P Midcap 400 Index ($MID) shed 1.6% and 1.5% respectively. All the main stock market indexes closed at their dead lows of the day, and in the bottom half of their trading ranges for the week.
Despite the sharp losses, volume eased slightly across the board. Total volume in the NYSE was 4% lighter than the previous day’s level, while volume in the Nasdaq edged 3% lower. Frequently, it is positive when lower volume accompanies a substantial decline in the broad market. However, when the major indices are already in a downtrend, higher volume losses become less of an issue because stocks can continue drifting lower due simply to a lack of buying interest. We pay much more attention to higher volume selling (“distribution days”) may be running out of steam. Market internals started out positive, but obviously steadily deteriorated throughout the day to finish negative.
Although stocks managed to retain a small portion of their November 1 gains, the technical situation created by last Friday’s decline puts the stock market in a rather precarious position. Specifically, each of the major indices formed a bearish engulfing candlestick pattern, which forms when an index or stock opens above the previous day’s high, but sells off to close all the way below the previous day’s low. This pattern can be clearly seen on the daily chart of PowerShares QQQ Trust ($QQQ), a popular ETF proxy that tracks the Nasdaq 100 Index:

As you may recall from this recent article on our trading blog, we prefer to sell short stocks and ETFs only after they’ve broken down below an obvious level of technical price support, then subsequently bounce into resistance level and form a bearish reversal pattern. One such ETF we came across in our nightly stock scanning that meets the criteria is iShares Dow Jones US Real Estate Index ETF ($IYR). We have annotated the trade setup on the daily chart of IYR below:

After bouncing off major support of its 200-day moving average on October 26, IYR move back above near-term resistance of its 20-day exponential moving average on November 2. However, notice that it formed a bearish reversal candle that same day by rallying substantially higher from its opening price, but reversing to close back down near its open. Furthermore, more substantial intermediate-term resistance of its 50-day moving average is now just above the intraday high of November 2. Additionally, the 20-day exponential moving average formed a bearish pattern by crossing down below its 50-day moving average several weeks ago. All these factors provide us with an ideal entry point for short sale entry into IYR, with a trigger price for entry below the November 2 low. Our stop price can be clearly defined above the prior swing high of October 19.
Because many of our subscribers trade in non-marginable cash accounts, such as IRA accounts, we are not “officially” planning to sell short IYR. Rather, we are looking for a buy entry into ProShares UltraShort Real Estate ETF ($SRS), an inversely correlated “short ETF,” instead. If you turn the chart of IYR upside down, the chart pattern of SRS is nearly (but not exactly) the same. The pattern is slightly different because inversely correlated and leveraged ETFs sometimes underperform the actual underlying index over longer holding periods. However, since we’re stalking this as a short-term, momentum-based trade, the degree of underperformance is not likely to be significant. Traders with marginable accounts who can sell short may wish to use our buy signal into SRS as a signal to sell short IYR instead, but our “official” trade setup on today’s ETF Watchlist is to buy SRS if it moves above the November 2 high.
As we’ve mentioned several times over the past two weeks, we’ve been monitoring both PowerShares QQQ Trust ($QQQ) and iShares Nasdaq Biotechnology Index ($IBB) for potential short sale on a significant rally into resistance. However, the previous day’s major weakness already sent QQQ right back down to near its recent lows, while IBB has been so weak that it actually closed the week at a new “swing low.” As such, there simply is not a positive reward-risk ratio for selling short either of these ETFs at this time. Nevertheless, since these two ETFs have been showing such considerable relative weakness to the broad market, they remain on our internal watchlist for when they inevitably and eventually manage to muster up the momentum for a significant short-term bounce into resistance. As for the long side of the market, select Emerging Markets ETFs continue to hold up well and show decent relative strength. But as the November 2 price action demonstrated, the broad market simply remains much too weak to attempt any bullish entries right now because current breakout attempts have a high likelihood of failure.
stock commentary:
There is no change to the market timing model and the plan remains to short stocks that bounce in to resistance. $APPL is once again applying pressure to the Nasdaq as it broke its 200-day MA. As we mentioned all last week, we have no interest in going long until conditions improve.
We have one new short setup tonight in $KO. $KO has formed a head and shoulders like topping pattern on the weekly chart and the daily chart is in bad shape as well. Note the recent breakdown below price support at 37.00 and the 200-day MA. After a light volume bounce in to the 200ma, KO has stalled out at the declining 20-day EMA, forming two bearish candles in a row. Our short entry is on a BOUNCE, so we are using a SELL LIMIT ORDER. This means that we will only enter KO on the short side IF the price action can bounce to our trigger. We are looking for a simple 2 to 1 trade, using a potential undercut of the recent swing low as a target. The reason we are shorting on a bounce is so establish an entry with a more favorable reward to risk ratio.

If you are a new subscriber, please e-mail [email protected] with any questions regarding our trading strategy, money management, or how to make the most out of this report.
relative strength combo watchlist:
Our Relative Strength Combo Watchlist makes it easy for subscribers to import data into their own scanning software, such as Tradestation, Interactive Brokers, and TC2000. This list is comprised of the strongest stocks (technically and fundamentally) in the market over the past six to 12 months. The scan is updated every Sunday, and this week’s RS Combo Watchlist can be downloaded by logging in to the Members Area of our web site.