Neutral
– Singal generated on the close of April 15 (click here for more details)
today’s watchlist (potential trade entries):

Having trouble seeing the open positions graphic above? Click here to view it directly on your web browser instead.
open positions:
Below is an overview of all open positions, as well as a report on all positions that were closed only since the previous day’s newsletter. Net P/L figures are based on two separate $50,000 model portfolios (one for ETFs and one for stocks). Changes to open positions since the previous report are listed in pink shaded cells below. Be sure to read the Wagner Daily subscriber guide for important, automatic rules on trade entries and exits.

Having trouble seeing the open positions graphic above? Click here to view it directly on your web browser instead.
closed positions:
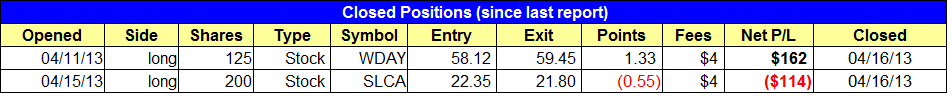
Having trouble seeing the closed positions graphic above? Click here to view it directly on your web browser instead.
ETF position notes:
- No trades were made.
stock position notes:
- Sold $SLCA on the open for a small loss. Sold $WDAY on the open for a small gain.
ETF, stock, and broad market commentary:
Stocks recovered from Monday’s selling with solid gains across the board, taking back nearly 2/3 of the prior day’s losses in the S&P 500 and Nasdaq, with both averages closing back above the 20-day EMA. The S&P Midcap 400 reclaimed the 50-day MA, so the only major index below the 50-day MA right now is the small cap Russell 2000. Turnover was lighter on the day, but the price action was definitely positive.
Leading stocks appear to be holding up as well, with $LNKD, $AMZN, $TSLA, $EBAY, $AMBA, $CELG, and $PRLB (to name a few) either holding steady or finding support at logical levels. Homebuilders and transportation stocks have not impressed as of late, but they continue to base out and that is a good sign (check out $ITB and $IYR).
While money has flowed out of BRIC ETFs (Brazil, Russia, India, China), Southeast Asia continues to be a hot spot with bullish chart patterns in Indonesia ($EIDO), Thailand ($THD), and Singapore ($EWS). The first two ETFs ($EIDO and $THD) are official setups on today’s watchlist.
iShares MSCI Thailand ($THD) has formed a bullish basing pattern during the past five weeks.

After three shakeouts below the 50-day MA (on 3/22, 4/5, and 4/15), $THD has reclaimed the 50-day MA and is poised to break the downtrend line of the consolidation. The buy entry is above Tuesday’s high for partial size. We will look to add to the position at new highs or lower if a tight-ranged handle forms below $93.
The weekly chart of $THD has found support around the 10-week moving average, which is a bullish sign. Note the strong uptrend that is in place.

iShares MSCI Indonesia ($EIDO) has formed a tight-ranged base while holding the rising 10-week moving average, indicating that the action is very tight. We also see that the current base has formed just below the prior high of 2011, so a breakout above the current range should propel the action to new highs, with no overhead resistance.

Dropping down to the daily chart, we see $EIDO potentially forming higher lows within the base, which is a sign of constructive price action. This is the first pullback to the 50-day moving average since the base breakout in February. The first touch of the 50-day MA is usually where institutions step in to support price action in a strong uptrend. Unless $EIDO can pull back to the 20-day EMA first, the buy entry is on a breakout to new highs.

On the stock side, $AMBA returns to the watchlist once again after undercutting support at $13 on Monday. If $AMBA can climb above the two-day high, then it will be back above all the moving averages that we follow on the daily and intraday charts (60 minute, 15 minute, and 5 minute), making for a low risk entry point. Tune in to Wednesday’s webinar at 12 pm for a clear explanation of how we look for entry points above all the moving averages (link to webinar is at the top of the report).

The market has been amazingly resilient since late February. The key to this rally is the action in leading stocks. If they continue to hold and new breakouts emerge, then the broad based averages will follow.
relative strength combo watchlist:
Our Relative Strength Combo Watchlist makes it easy for subscribers to import data into their own scanning software, such as Tradestation, Interactive Brokers, and TC2000. This list is comprised of the strongest stocks (technically and fundamentally) in the market over the past six to 12 months. The scan is updated every Sunday, and this week’s RS Combo Watchlist can be downloaded by logging in to the Members Area of our web site.