market timing model:
Confirmed Buy – Signal generated on the close of September 4 (click here for more details) (we are on a buy signal from the close of Aug. 16)
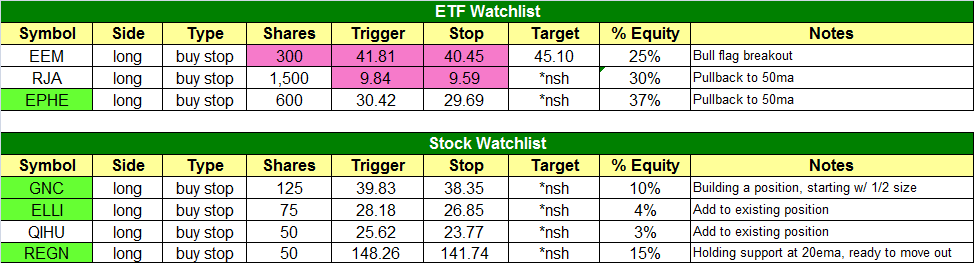
today’s watchlist (potential trade entries):
Having trouble seeing the open positions graphic above? Click here to view it directly on your web browser instead.
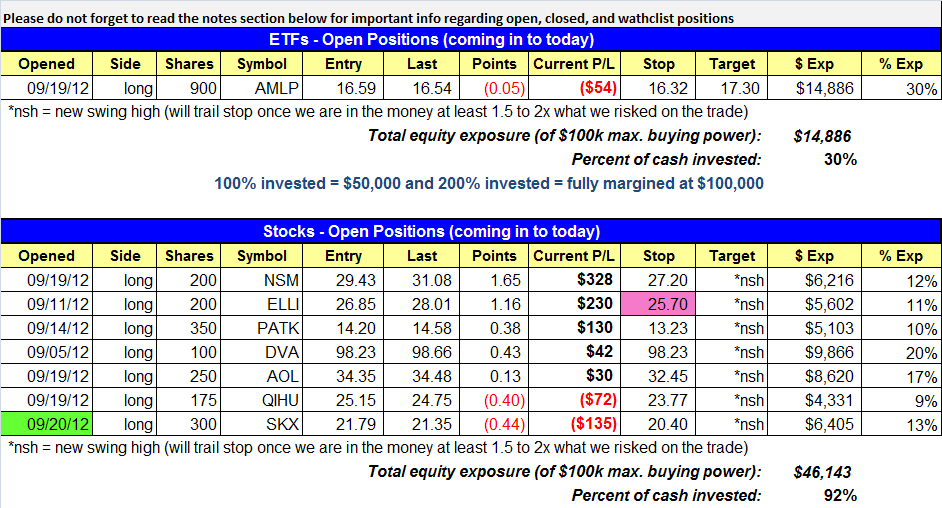
open positions:
Below is an overview of all open positions, as well as a report on all positions that were closed only since the previous day’s newsletter. Net P/L figures are based on two separate $50,000 model portfolios (one for ETFs and one for stocks). Changes to open positions since the previous report are listed in pink shaded cells below. Be sure to read the Wagner Daily subscriber guide for important, automatic rules on trade entries and exits.
Having trouble seeing the open positions graphic above? Click here to view it directly on your web browser instead.
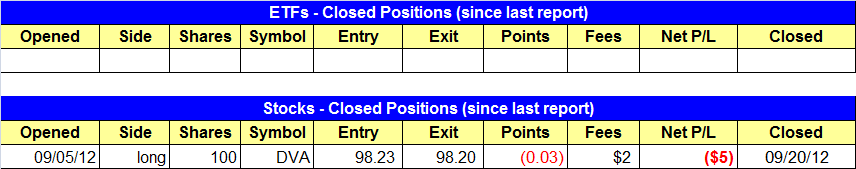
closed positions:
Having trouble seeing the closed positions graphic above? Click here to view it directly on your web browser instead.
ETF position notes:
- Note the changes in the watchlist section.
stock position notes:
- DVA hit our break-even stop.
- Correction to yesterday’s exit price in QCOR. The stop order was filled at 48.12.
ETF and broad market commentary:
Gapping lower on the open, stocks got off to a rough start yesterday morning, but the broad market grinded its way higher throughout the day, causing the main stock market indexes to finish near the flat line and with mixed results. The Dow Jones Industrial Average ($DJIA) edged 0.1% higher, the S&P 500 Index ($SPX) slipped 0.1%, and the Nasdaq Composite dipped 0.2%. The small-cap Russell 2000 and S&P MidCap 400 indices declined 0.5% and 0.7% respectively. All the major indices finished near their intraday highs, as the bulls demonstrated their resilience.
Total volume in the NYSE ticked 4% higher, while volume in the Nasdaq was 2% lighter than the previous day’s level. Market internals were negative, but only moderately so. In the NYSE, declining volume exceeded advancing volume by a ratio of 2 to 1. The Nasdaq ADV/DEC volume ratio was negative by less than 3 to 2. Although turnover in the NYSE rose slightly, volume was still below its 50-day average level. This tells us banks, mutual funds, hedge funds, and other institutions were not in sell mode yesterday.
In yesterday’s newsletter, we pointed out the potential trade setup in iShares Emerging Markets Index ($EEM). Although listed on our watchlist, the trade did not hit our trigger price for buy entry. However, yesterday’s price action in EEM now makes our reward to risk ratio even more favorable for buy entry because the ETF gapped lower on the open, then reversed to close at its intraday high. This resulted in the formation of a bullish reversal candlestick, which is shown on the daily chart below:

Looking at the weekly chart again, notice that yesterday’s pullback also caused EEM to come into new support of its prior downtrend line from the 2011 high. One of the most basic tenets of technical analysis is that a prior level of resistance becomes the new level of support, after the resistance is broken. Therefore, the prior downtrend line shown on the weekly chart below should provide substantial support for EEM:

When a stock or ETF is forming a bull flag chart pattern and then gaps down sharply, it has the effect of washing out the “weak hands” who sell a position that the first hint of trouble. This is positive because it absorbs overhead supply from traders who would otherwise be selling into the next move up. The end result is that it makes it easier for the stock or ETF to move higher when the buyers step back in. Then, traders who sold at the lows feel regret, which causes them to buy at a higher level, thereby adding to the bullish momentum. The other benefit of a stock that gaps down, but closes with a bullish reversal candlestick, is that it makes it easier for us to clearly define our stop price just below the low of the reversal bar. For these reasons, we now like the EEM trade even better. Notice on the watchlist above that we have adjusted both the trigger and stop prices for the EEM swing trade setup.
We also mentioned in yesterday’s newsletter that several other international ETFs were starting to look good. One of those is iShares Philippines ($EPHE), which just broke out to a new all-time high and has pulled back to new support of its breakout level. In addition to EEM, we have added EPHE to our watchlist for potential buy entry today. The weekly chart pattern of EPHE is shown below:

One other international ETF we are monitoring is iShares Mexico ($EWW). It is not an “official” trade setup for entry yet, but it is definitely on our radar screen as a potential breakout candidate. The long-term monthly chart of EWW is shown below:

The other ETF that was on our watchlist yesterday, Elements Intl. Agriculture ($RJA), did not yet trigger for buy entry, but remains on our watchlist going into today. Note the slightly adjusted trigger price. If it does not trigger, or at least form a bullish reversal bar, in today’s session, we will probably remove it from our watchlist on Monday.
stock commentary:
Friday is triple options expiration, so we can expect a ton of volume to hit the market. We added a few new names to the watchlist as the market continues to pull back in orderly fashion. Most of our positions are in pretty good shape and should run higher if/when the market resumes the current uptrend.
We like yesterday’s reversal bar action in ELLI, so we have a buy stop order to add to the position if it can break above Thursdays high. If the entry works out we will have a solid 15% position size in a stock that has the potential to run 20-40% in 2-4 weeks.
If you are a new subscriber, please e-mail [email protected] with any questions regarding our trading strategy, money management, or how to make the most out of this report.
relative strength combo watchlist:
Our Relative Strength Combo Watchlist makes it easy for subscribers to import data into their own scanning software, such as Tradestation, Interactive Brokers, and TC2000. This list is comprised of the strongest stocks (technically and fundamentally) in the market over the past six to 12 months. The scan is updated every Sunday, and this week’s RS Combo Watchlist can be downloaded by logging in to the Members Area of our web site.