Current signal generated on close of Feb. 3.
Portfolio exposure can be anywhere from 0% to 60% long (or more), depending on how open positions have held up.
Past signals:
Neutral signal generated on close of January 24.
- Buy signal generated on close of November 13
- Buy signal generated on close of September 9
- Neutral signal generated on close of August 15
- Buy signal generated on close of July 11
- Neutral signal generated on close of July 5
- Sell signal generated on close of June 24
today’s watchlist (potential trade entries):

Having trouble seeing the open positions graphic above? Click here to view it directly on your web browser instead.
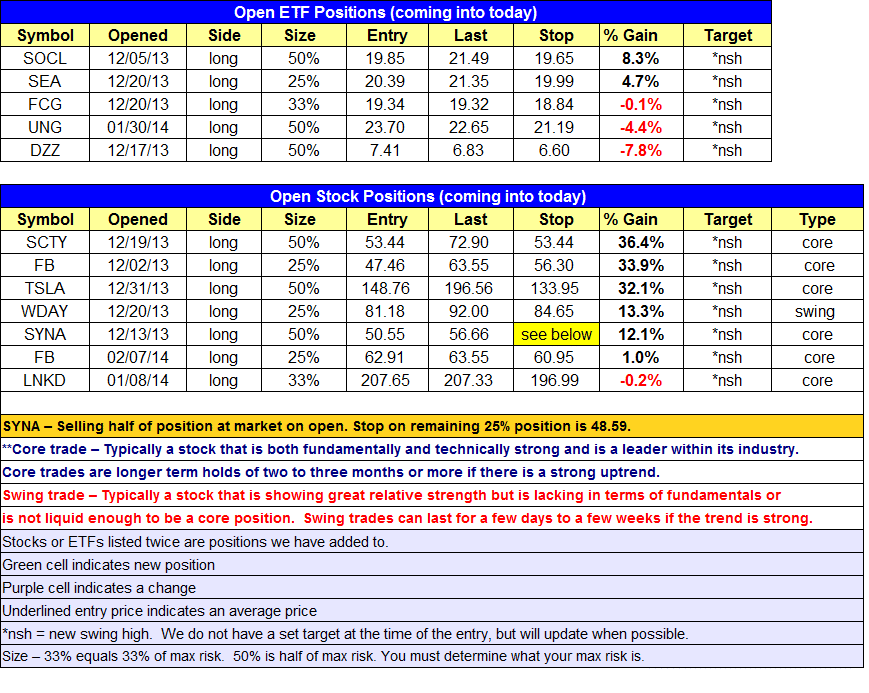
Below is an overview of all open positions, as well as a report on all positions that were closed only since the previous day’s newsletter. Changes to open positions since the previous report are listed in pink shaded cells below. Be sure to read the Wagner Daily subscriber guide for important, automatic rules on trade entries and exits.

Having trouble seeing the open positions graphic above? Click here to view it directly on your web browser instead.
closed positions:

Having trouble seeing the closed positions graphic above? Click here to view it directly on your web browser instead.
ETF position notes:
- No trades were made.
stock position notes:
- Selling 1/2 of $SYNA at market on the open.
ETF, stock, and broad market commentary:
Once again tech stocks were relatively strong, with the Nasdaq Composite and Nasdaq 100 posting gains of + 0.5%. The S&P 500 lagged with only a + 0.2% gain, while the Dow Jones barely closed positive on the day at +0.05%.
Volume was lighter on the Nasdaq, preventing the Nasdaq Composite from logging a second straight accumulation day. Overall, the market volume patterns remain bearish with only one day of accumulation between the S&P 500 and Nasdaq in several weeks.
Even if the Nasdaq was to breakout to new highs, we would not expect a significant rally to emerge if the S&P 500 was unable to clear the 50-day MA. What this simply means is that the odds favor the market trading in a range for a period of time until conditions change (for better or worse).
What is shortable: Russia, Brazil (and most of South America), and emerging market ETFs.
What is showing relative strength: Europe (Italy and Spain), Vietnam, natural gas (stocks and the commodity), and gold mining stocks
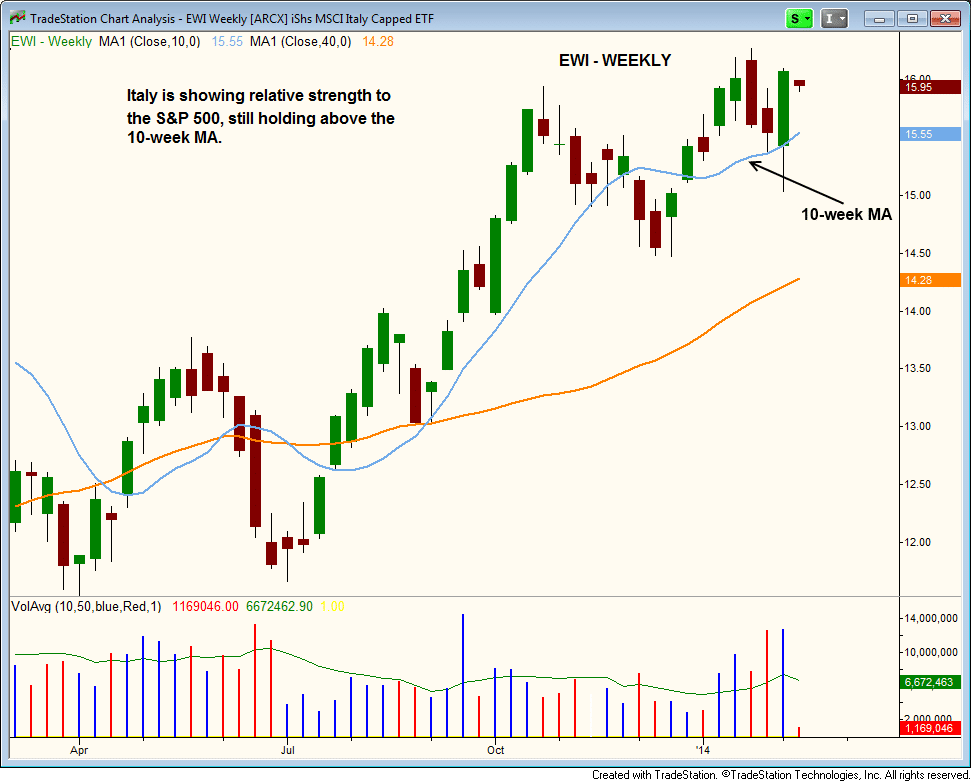
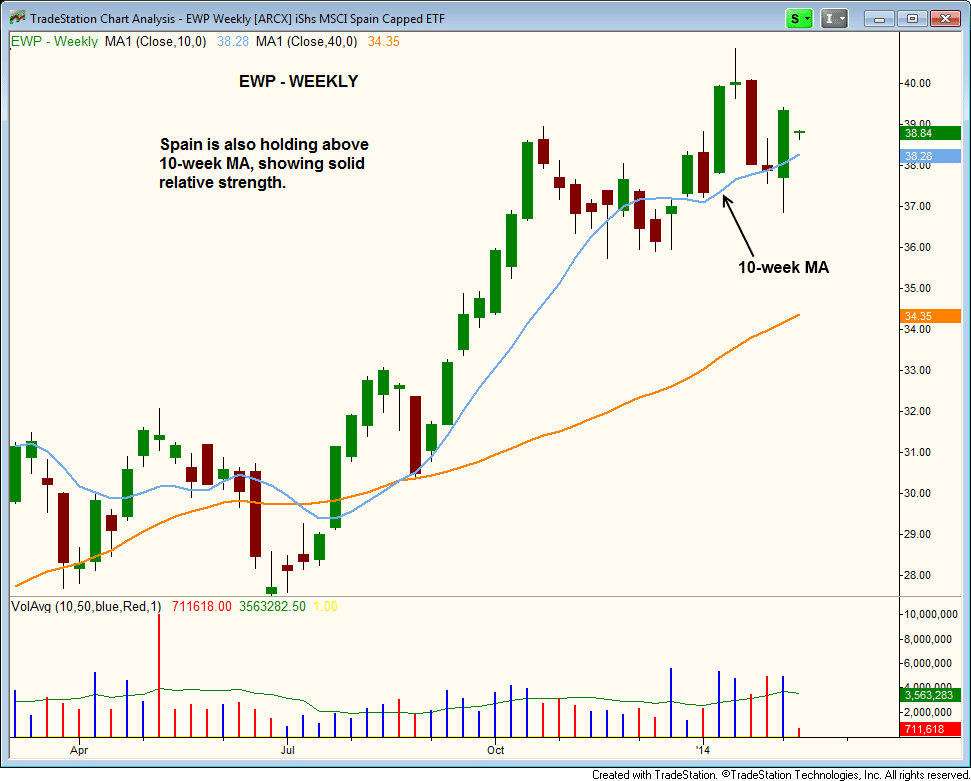
Italy ETF ($EWI) and Spain ETF ($EWP) have held up surprisingly well the past few weeks and are still trading above the 10-week MA.
The 10 and 40-week MAs are still trending higher on both weeks charts with a higher swing low in place (so far):


If both these ETFs hold up well during a market correction, then they would make ideal buy candidates once the market settles down.
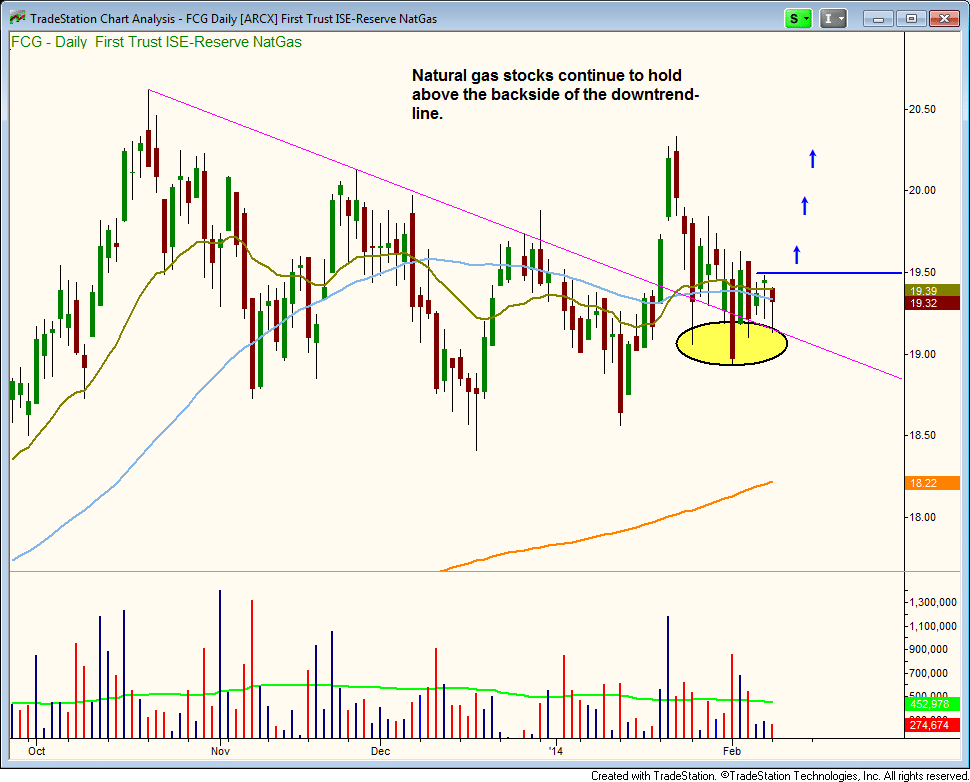
Along with Europe, we continue to see strength in natural gas stocks. First Trust ISE Revere Natural Gas ($FCG) is still holding the back side of the downtrend line, which is a bullish sign. However, the price action has failed to extend much beyond the 50-day MA.

We remain long $FCG from our $19.34 entry several weeks ago. For those who missed the first entry, a move above the three-day high is a low risk buy point for those who wish to establish some exposure. Please use the protective stop listed for UNG in the open positions section above.
On the stock side, we plan to ditch half of our position in $SYNA at the market on Tuesday’s open. We feel pretty comfortable holding on to $FB, $TSLA, and $SCTY with 50% size, as these stocks are sitting at new highs.
In a bull market, despite late entry points and blowing stops, undisciplined traders can make still money, as a strong uptrend is a cure-all. However, when conditions turn sour, the undisciplined trader is often exposed, and the P&L can go from good to very bad in just in a day or two when swing trading with size.
Since it appears that the markets are range-bound, a test of the recent lows in the major averages (within the next week or two) would not be much of a surprise. Remember, do not over-trade this market!