Confirmed Buy– The timing model was upgraded to a confirmed buy on the close of January 22. However, the initial buy signal was generated on the close of December 31. (click here for more details)
today’s watchlist (potential trade entries):

Having trouble seeing the open positions graphic above? Click here to view it directly on your web browser instead.
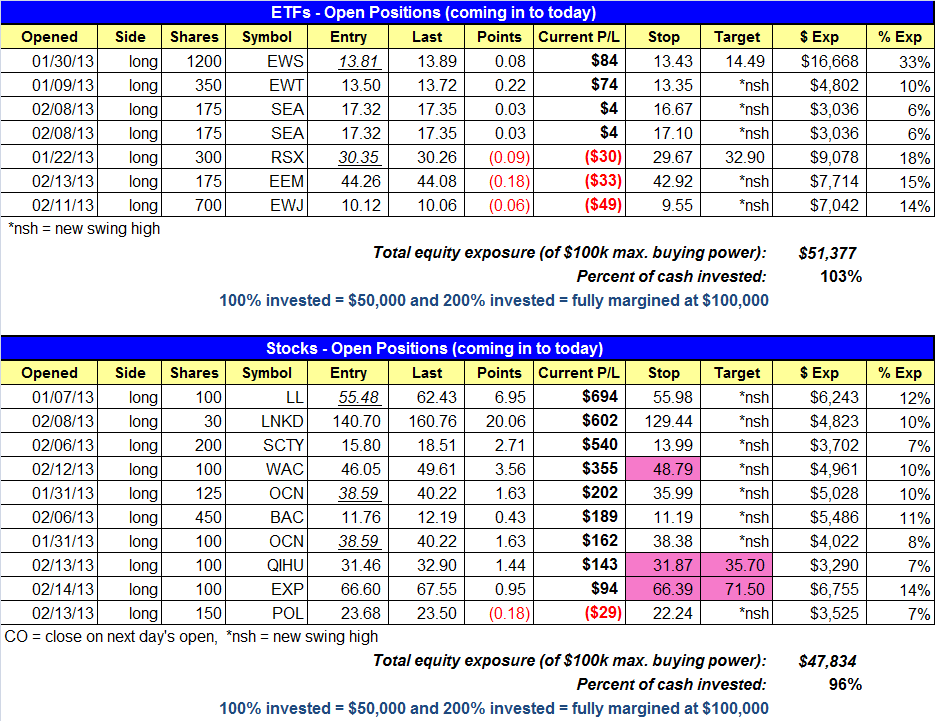
open positions:
Below is an overview of all open positions, as well as a report on all positions that were closed only since the previous day’s newsletter. Net P/L figures are based on two separate $50,000 model portfolios (one for ETFs and one for stocks). Changes to open positions since the previous report are listed in pink shaded cells below. Be sure to read the Wagner Daily subscriber guide for important, automatic rules on trade entries and exits.
Having trouble seeing the open positions graphic above? Click here to view it directly on your web browser instead.
closed positions:
Having trouble seeing the closed positions graphic above? Click here to view it directly on your web browser instead.
ETF position notes:
- We are buying $FDN on the open using a market order (5-minute rule does not apply)
stock position notes:
- No trades were made.
ETF, stock, and broad market commentary:
Stocks posted a solid gains across the board, with the Nasdaq Composite breaking out and closing above the resistance highs of last September. Total volume dropped off on the advance in both exchanges, but as we have mentioned in prior reports, accumulation days are not as important once a rally has built up enough momentum. It is far more important to monitor distribution after an extended move.
Many traders get caught up in making all or nothing decisions in their trading. For example, there were probably many traders who could not pull the trigger on the buy side after the big market gap up in early January. Many may have simply said “Man, this is too high, I’ll just wait for a pullback”. They could not pull the trigger out of fear of losing money. When we are in a similar situation, we take pressure off by acknowledging that in order to make money we have to take on risk (this is what we do). Then, rather than buying a full position, we buy a half position, a third, or even a quarter and try to add on success. This small position give us some confidence if it works, and we can build on that confidence with follow up buys. If the buy does not work, so what, we lost a little bit of money.
The First Trust Dow Jones Internet Index ($FDN) broke out from a short-term consolidation yesterday.

Note the difference between a base breakout and a continuation breakout. A base breakout is the original move out from a lengthy consolidation, typically seven weeks or more in time. After the stock/ETF breaks out, a short-term pause of 5 to 15 days can lead to a second breakout. This pause is the continuation breakout setup. For example, a bull-flag is a type of continuation breakout.
On the chart above, $FDN paused for three-weeks before clearing the highs of the base. Since Tuesday’s close triggered a buy signal, we are buying $FDN on the open with a market order. Please wait until the market opens to place the order. The 5-minute rule does not apply to this trade, as we are buying right on the open. The stop is placed below the 20-day EMA and the reversal candle low of 2/7.
After a strong rally off the 200-day MA in January, the ProShares Ultra Oil & Gas ($DIG) has been consolidating in a tight range the past three weeks. The first breakout attempt failed three sessions ago, but the price action held above the 20-day EMA on the pullback. The false breakout high on 2/14 now serves as our buy entry. The stop is placed beneath the lows of the range and the 20-day EMA, minus some wiggle room.

On the stock side, $LL reversed nicely ahead of earnings on Wednesday. We are holding through earnings. If you do not want to hold please exit before the close.
We raised the stop in $WAC in case it fails to push through to new highs.
We originally planned to hold $QIHU through earnings, but upon further analysis we will close the trade prior to earnings, which is scheduled for Feb. 27 (unconfirmed). Although $QIHU has great relative strength and fundamentals, the stock has been dragged through the mud by certain research companies, making it more of a gamble to hold. For now we have a very tight stop in. If we get lucky, $QIHU will breakout ahead of earnings and give us a chance to exit in to strength.
We are running a “just below break-even” stop in $EXP. We never loved the reward to risk ratio of this setup due to the prior highs around 72.00 on the weekly chart, so we are playing it very tight. It either takes off from here or we take a very small scratch loss.
We have an open order to add to an existing position in $BAC. The entry is over Tuesday’s high with a stop beneath the most recent swing low for the shares added only. Keep the stop the same for the original shares purchased.
If you are a new subscriber, please e-mail [email protected] with any questions regarding our trading strategy, money management, or how to make the most out of this report.
relative strength combo watchlist:
Our Relative Strength Combo Watchlist makes it easy for subscribers to import data into their own scanning software, such as Tradestation, Interactive Brokers, and TC2000. This list is comprised of the strongest stocks (technically and fundamentally) in the market over the past six to 12 months. The scan is updated every Sunday, and this week’s RS Combo Watchlist can be downloaded by logging in to the Members Area of our web site.