Buy
– Signal generated on the close of April 30 (click here for more details)
today’s watchlist (potential trade entries):

Having trouble seeing the open positions graphic above? Click here to view it directly on your web browser instead.
open positions:
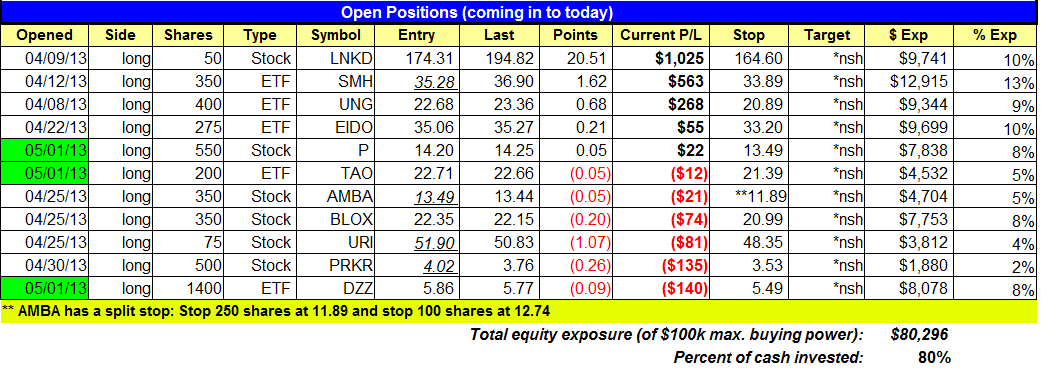
Below is an overview of all open positions, as well as a report on all positions that were closed only since the previous day’s newsletter. Net P/L figures are based a $100,000 model portfolio. Changes to open positions since the previous report are listed in pink shaded cells below. Be sure to read the Wagner Daily subscriber guide for important, automatic rules on trade entries and exits.

Having trouble seeing the open positions graphic above? Click here to view it directly on your web browser instead.
closed positions:

Having trouble seeing the closed positions graphic above? Click here to view it directly on your web browser instead.
ETF position notes:
- $TAO buy limit order triggered. $DZZ buy stop triggered over the 5-mintue high.
stock position notes:
- $CLDX stop triggered and we closed out the remaining 200 shares. Our gain on the full 500 share position was $865
ETF, stock, and broad market commentary:
Stocks took a breather from their impressive run off their April 18 lows, as all the main stock market indexes fell 0.9% yesterday. Although the Nasdaq Composite, S&P 500, and Dow Jones Industrials gave back all of their previous day’s gains and then some, one positive element of yesterday’s session is that turnover eased 4% in both the NYSE and Nasdaq. This enabled the broad market to avert a “distribution day,” which would have been indicative of institutional selling into strength. Rather, it appears the bulls merely were taking a break.
One ETF on our radar screen for potential buy entry is First Trust Internet Index ($FDN). Unlike many of the strongest ETFs in the market that are near-term extended to the upside, $FDN has not yet broken out above its range. As such, one could understandably argue that the ETF has relative weakness and should be avoided. In many cases, that would be true. However, the difference here is that $FDN has been forming a constructive base of consolidation at its all-time highs. This is much different than buying an ETF that is trading near its lows and is only now attempting to reverse its downtrend. The weekly chart of $FDN below shows how the ETF has been consolidating for the past few months:

On the week ending March 8, notice that $FDN attempted to break out to a new high, but failed the following week. When this happens to an ETF or stock that is trading near its highs, it does not necessarily mean the setup becomes invalid. On the contrary, some of the most explosive upside moves occur when the first breakout attempt fails, but the equity subsequently breaks out and hold. Often, failed breakouts at the highs simply indicate a lengthier period of base building is required.
Zooming into the shorter-term daily chart interval, notice that a rally above yesterday’s high would present a valid buy entry point for a partial position. Additional shares could be added to the position on confirmation of a breakout above the highs of the range:

Despite the major indices losing 0.9% yesterday, $FDN showed relative strength on the day by slipping just 0.5%. This was aided by shares of LinkedIn ($LNKD), which ignored the weakness in the broad market and climbed 1.4% to another fresh record high. $FDN is primarily comprised of mid to large-cap internet stocks like Google ($GOOG), Netflix ($NFLX), and Yahoo! ($YHOO), each of which are trading at or near their 52-week highs. Click here to see the current portfolio of stocks that comprise the portfolio of $FDN.
Although we like the technical setup in $FDN, note that we are not adding it to our “official” watchlist today. This is because we already have sufficient exposure in the internet sector through three individual stock holdings ($LNKD, $BLOX, and $P). Nevertheless, we pointed out this $FDN trade setup for any subscribers who prefer to trade ETFs and wish to take the trade on their own. If this trade triggers by rallying above yesterday’s high, and you decide to take it on your own, consider a protective stop just below the April 18 low of $41.
By the way, speaking of internet stocks we are currently long, our open position in $LNKD is now showing an unrealized gain of nearly 12% (20 points) since our April 9 buy entry. As we said in yesterday’s newsletter, “$LNKD is scheduled to report earnings after the close on May 2, so if you are uncomfortable holding through earnings you should exit the position into strength ahead of the report (in Thursday’s session). Because we have a decent profit buffer we do not mind holding $LNKD through earnings.”
$CLDX triggered our adjusted stop on the remaining 200 shares, locking in a $222 profit. Total profit on the full 500 shares was $865 (11.51 entry w/ 13.26 avg price on exit).
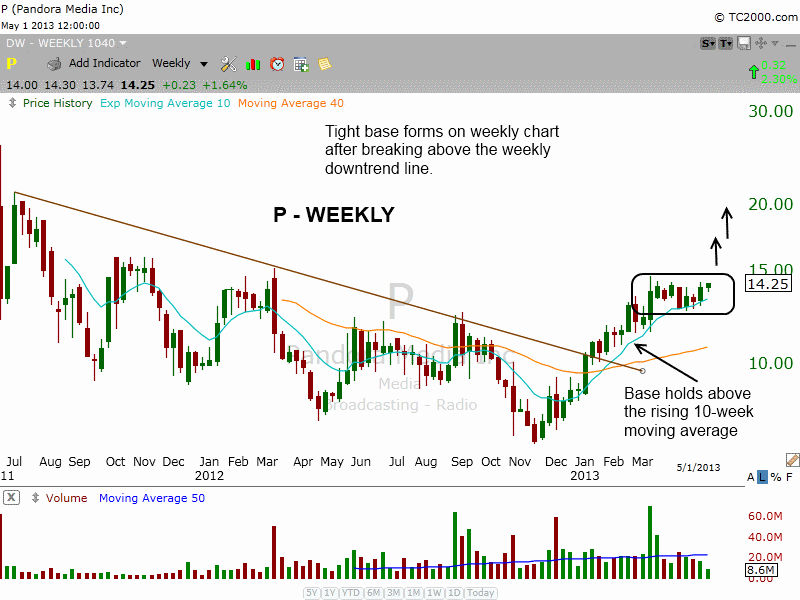
We added $P to the model portfolio yesterday, which held up relatively well while the market sold off. The weekly chart of $P shows the bullish consolidation above the 10-week MA:

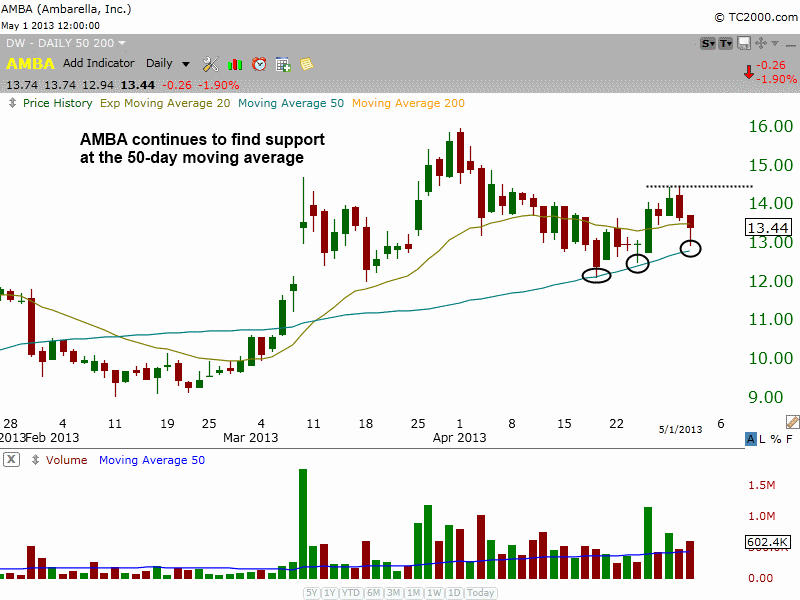
$AMBA found support around the 50-day MA, reversing off the lows to close in the top 40% of the day’s range.

Ideally, we’d like to see $AMBA put in a few days of sideways action and eventually break out above the high of 4/30.
$URI sold off on higher volume after stalling at the 50-day MA. We don’t like to sit in stocks that stay below the 50-day MA too long, but as long as $URI continues to set higher lows in the base the action is acceptable (and we have very small size).
$PRKR has stalled on three attempts to break the $4 level. Yesterday’s selling was not good price action. Hopefully the 50-day MA can provide support.
$BLOX recovered from a morning gap down to close above the 20-day EMA. There is solid support with the 50-day MA just below.
$LNKD ignored the selling in the market and pushed to new highs. We plan to hold through tomorrow’s earnings report after the close.
relative strength combo watchlist:
Our Relative Strength Combo Watchlist makes it easy for subscribers to import data into their own scanning software, such as Tradestation, Interactive Brokers, and TC2000. This list is comprised of the strongest stocks (technically and fundamentally) in the market over the past six to 12 months. The scan is updated every Sunday, and this week’s RS Combo Watchlist can be downloaded by logging in to the Members Area of our web site.