Current signal generated on close of Feb. 13.
Portfolio exposure can be anywhere from 50% to 100% long (or more), depending on how open positions have held up.
Past signals:
- Sell signal generated on close of February 3.
- Neutral signal generated on close of January 24.
- Buy signal generated on close of November 13
- Buy signal generated on close of September 9
- Neutral signal generated on close of August 15
- Buy signal generated on close of July 11
- Neutral signal generated on close of July 5
- Sell signal generated on close of June 24
today’s watchlist (potential trade entries):

Having trouble seeing the open positions graphic above? Click here to view it directly on your web browser instead.
Below is an overview of all open positions, as well as a report on all positions that were closed only since the previous day’s newsletter. Changes to open positions since the previous report are listed in pink shaded cells below. Be sure to read the Wagner Daily subscriber guide for important, automatic rules on trade entries and exits.

Having trouble seeing the open positions graphic above? Click here to view it directly on your web browser instead.
closed positions:
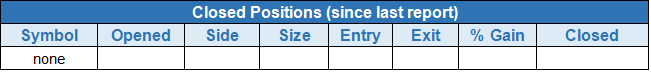
Having trouble seeing the closed positions graphic above? Click here to view it directly on your web browser instead.
ETF position notes:
- $BZQ failed to officially trigger due to the 5-minute rule. If you are already in, it is probably best to sell on a bounce (if there is one tomorrow) or use a tight stop 10- 15 cents below Thursday’s low. We may look to enter on a pullback to the 50-day MA, since yesterday’s action was weak.
stock position notes:
- $CMG buy entry triggered.
ETF, stock, and broad market commentary:
After overcoming a morning gap down, stocks rallied higher the rest of the sesion and closed near the highs of the day. The strong rally off the lows produced bullish reversal candles in all the major averages.
Volume confirmed the move in the Nasdaq, with another accumulation day. Volume was lighter on the NYSE, but the S&P 500 did hold the 50-day MA.
Given the strength of this week’s price and volume action in the Nasdaq Composite, the timing model is now back in buy mode.
The small-cap Russell 2000 reclaimed the 50-day MA, leaving the Dow Jones as the only major average yet to return above the “line in the sand” average. We call the 50-day MA our line in the sand during a bull market. Stocks and ETFs above the 50-day remain on our internal watchlist, while those below are removed.
Tech stocks continue to outperform with the Nasdaq 100 breaking above the highs of the base, led by $FB, $PCLN, $AMGN, $NFLX, $GOOG, and $BIIB.
After forming a bullish reversal candle on big volume last week, PowerShares Dynamic Building & Construction ETF ($PKB) has cleared the 10-week MA and the prior week’s high, which is a buy signal.
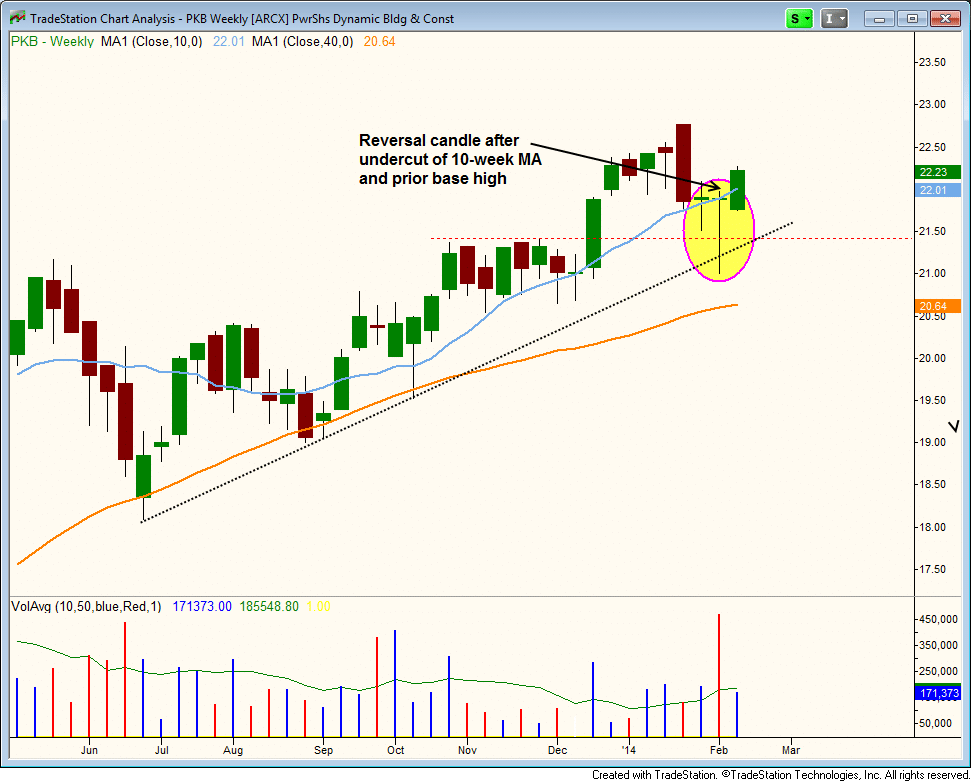
On the weekly chart, we see no real distribution at all over the past several months, which is a great sign. $PKB is sitting just below all-time highs, so it is a potential breakout on multiple time frames.
We are placing $PKB on today’s watchlist. Trade details can be found above.
After undercutting a 6-week low and the 10-week MA early last week, $EWP put in a bullish reversal candle with a close at the highs of the week.
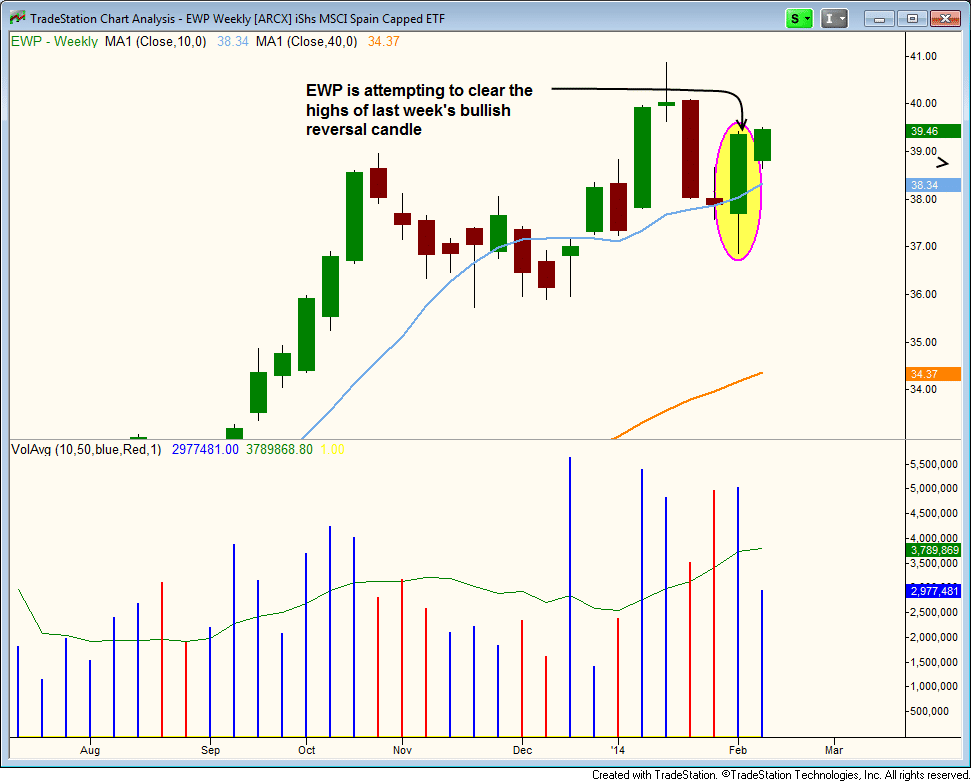
A move above last week’s high is a buy signal on the weekly chart, so we are placing $EWP on today’s watchlist. Trade details can be found above.
Although there is no chart listed, $TAN is also on today’s watchlist as a potential buy entry. For those who were triggered in the $BZQ buy setup Thursday morning, please see the notes section above.
On the stock side, $CMG triggered a buy entry above the three day high on decent volume. We look for follow through to the upside next week.
We have a few new setups today. Two potential swing trades in $WBAI and $RSOL. Both of these trades should be sized smaller than $INVN, which is a core setup.
$INVN is a potential breakout on multiple time frames, which is why we like the setup so much. After gapping up on big volume, it has pulled back on lighter volume to last week’s high. We look for the price action to chop around for the next few day’s as the 10-day MA catches up.
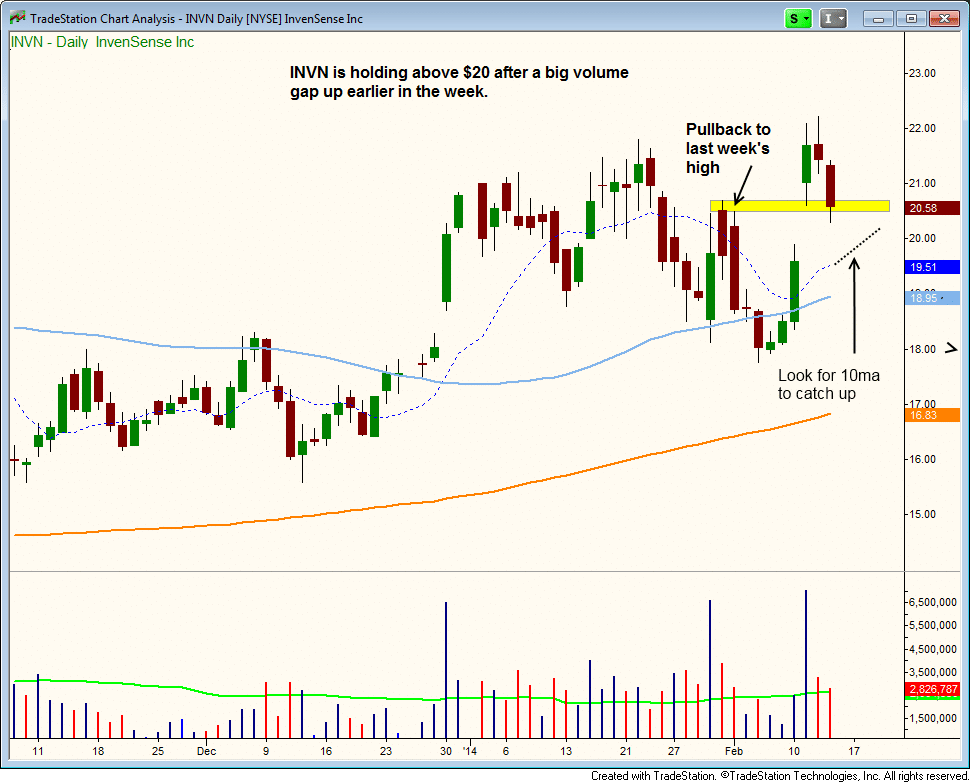
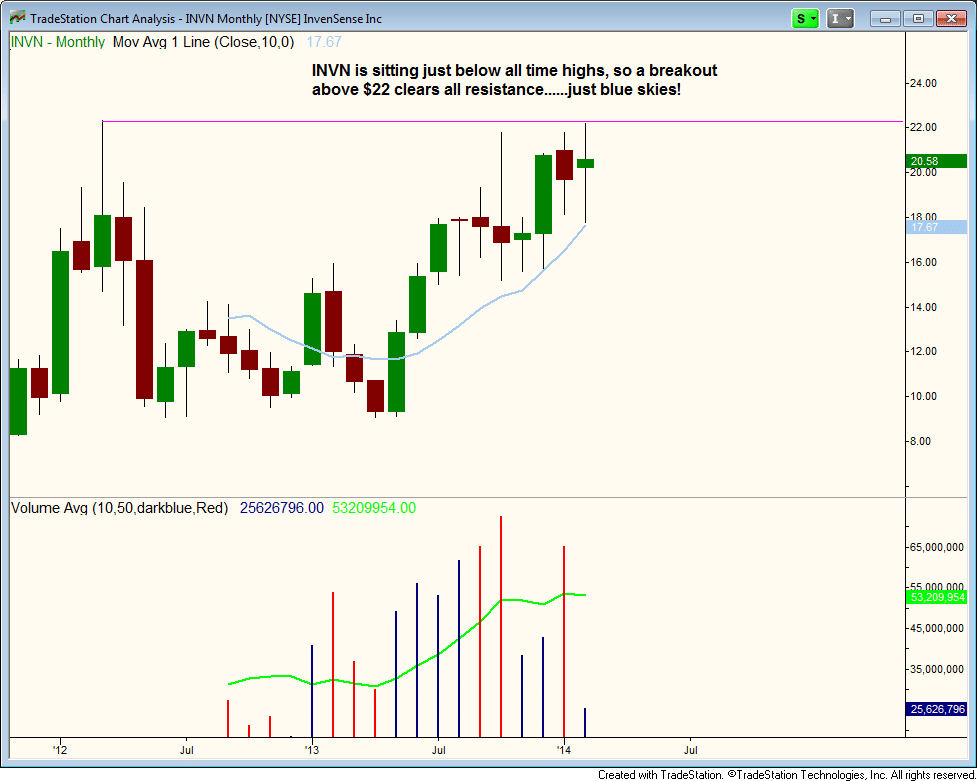
With our entry, we are looking to establish some size on weakness and potentially add if/when the 10-day catches up.
The stop is about 10% away, just below the 50-day MA to give the setup a little wiggle room.