market timing model:
Neutral – Signal generated on the close of August 2 (click here for more details)
today’s watchlist (potential trade entries):

open positions:
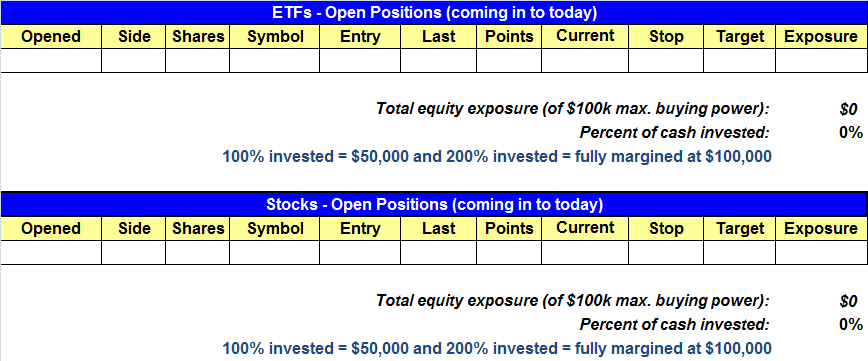
Below is an overview of all open positions, as well as a report on all positions that were closed only since the previous day’s newsletter. Net P/L figures are based on two separate $50,000 model portfolios (one for ETFs and one for stocks). Changes to open positions since the previous report are listed in red shaded cells below. Be sure to read the Wagner Daily subscriber guide for important, automatic rules on trade entries and exits.

Having trouble seeing the open positions graphic above? Click here to view it directly on your web browser instead.
closed positions:

Having trouble seeing the closed positions graphic above? Click here to view it directly on your web browser instead.
ETF position notes:
- No trades were made.
stock position notes:
- No trades were made.
ETF and broad market commentary:
Following back to back sessions of light volume rallies, stocks closed higher yesterday on an uptick in trade. All of the major indices finished the session higher. However, a spurt of late session selling left stocks well off session highs. The S&P MidCap 400 led the move higher, as it added a solid 1.0%. Both the Nasdaq and the small-cap Russell 2000 tacked on 0.9%, while the S&P 500 and the Dow Jones Industrial Average improved by 0.5% and 0.4% respectively. Overall, yesterday’s gains were solid but lacked conviction.
Market internals were bullish yesterday. Volume climbed by 24% on the Nasdaq and 18.8% on the NYSE. Further, advancing volume topped declining volume by a ratio of 2.3 to 1 on the NYSE and 4.0 to 1 on the Nasdaq. Despite the positive price action, yesterday marked the first time in three days that the market posted an accumulation day. However, the fact that both indices closed well off sessions highs suggests that the market may be losing some steam. Strong accumulation days occur when the market closes at session highs on expanding volume.
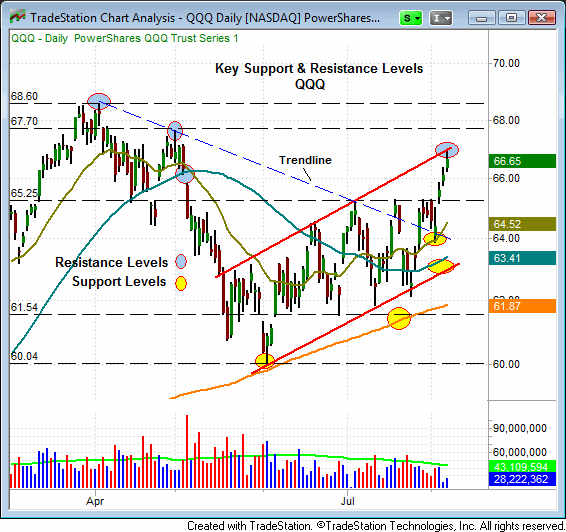
Yesterday, the PowerShares Nasdaq Composite ETF (QQQ) rallied into resistance of the upper trend line of its trend channel, and then sold off to close in the middle of the intraday range. Yesterday’s high should now serve as a significant resistance level for QQQ. Above this key mark, QQQ has resistance at $67.70 and $68.60. Should QQQ pull back from the current level, it should find support near $65.25 (the breakout), $64.50 (20-day EMA) and $63.40 (50-day MA).

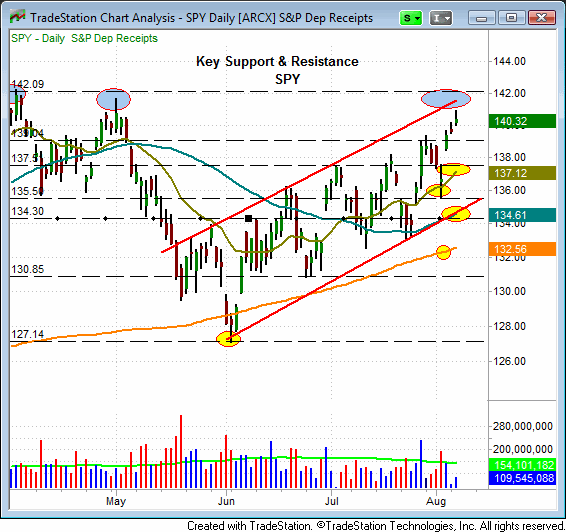
The Daily S&P Depository Receipts (SPY) also found resistance near the upper trend line of its trend channel. However, the SPY found resistance just below this key mark. Above yesterday’s high SPY should find resistance from $141.50 to $142.10. On a pullback, SPY has support at its 20-day EMA ($137.12), its previous swing low of $135.50 and the convergence of its lower trendline and its 50-day MA ($134.30).

The market continues to grind higher but in a somewhat unconvincing manner. On Monday and Tuesday we saw strong price action but no volume. Yesterday, we saw the market rally on strong volume but unconvincing price action, as the major indices faded into the close. Now that the broad market is at key resistance, we expect to see a pullback in the next day or two.
stock commentary:
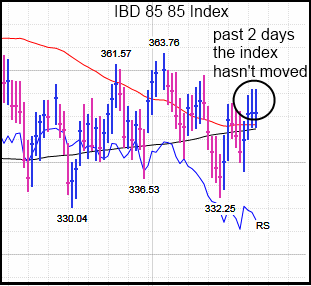
The chart below is a snapshot of the IBD 85/85 Index, which is comprised of stocks that rank in the top 15% of all stocks both technically and fundamentally. This is a growth index. While the S&P 500 has pushed higher the past few days, the 85/85 Index has gone nowhere.

We ran a simple scan that compared today’s closing price versus the close three days ago on the Ruseell 1000 (large cap index). In scanning the 50 biggest percent movers, we found that 43 of the 50 started their move from below the 200-day moving average, which means that most of the stocks rallying are the “junk off the bottom” plays. The fact that the small and mid-cap stocks continue to lag remains a concern.
We added ONXX to the watchlist. Let’s see if the biotech sector can come back to life after selling off last week.
If you are a new subscriber, please e-mail [email protected] with any questions regarding our trading strategy, money management, or how to make the most out of this report.
relative strength combo watchlist:
Our Relative Strength Combo Watchlist makes it easy for subscribers to import data into their own scanning software, such as Tradestation, Interactive Brokers, and TC2000. This list is comprised of the strongest stocks (technically and fundamentally) in the market over the past six to 12 months. The scan is updated every Sunday, and this week’s RS Combo Watchlist can be downloaded by logging in to the Members Area of our web site.