market timing model:
SELL – Signal generated on the close of July 10 (click here for more details)
today’s watchlist (potential trade entries):

open positions:
Below is an overview of all open positions, as well as a report on all positions that were closed only since the previous day’s newsletter. Net P/L figures are based on two separate $50,000 model portfolios (one for ETFs and one for stocks). Changes to open positions since the previous report are listed in red shaded cells below. Be sure to read the Wagner Daily subscriber guide for important, automatic rules on trade entries and exits.

Having trouble seeing the open positions graphic above? Click here to view it directly on your web browser instead.
closed positions:

Having trouble seeing the closed positions graphic above? Click here to view it directly on your web browser instead.
ETF position notes:
- Note we are selling UNG at the market on Tuesday’s open to lock in gains.
stock position notes:
- LNKD stop triggered on half the position (25 shares) at 103.78.
ETF and broad market commentary:
Stocks gapped sharply lower at the open on Monday, but clawed their way back to close near session highs. Trade was light. High beta stocks led the decline. The small-cap Russell 2000 plunged 1.6% while the S&P MidCap 400 and the Nasdaq slid 1.3% and 1.2% respectively. The S&P 500 lost 0.9% and the Dow Jones Industrial Average fell 0.8%.
Market internals ended the session mixed. Volume dropped on the Nasdaq by 10.1% and on the NYSE by 6.2%. However, declining volume easily outpaced advancing volume on both exchanges by a factor of 4.4 to 1. The market escaped distribution yesterday, as volume was light. Although the DJIA, S&P 500 and Nasdaq all finished well off session lows, the light volume accompanying the recovery casts a shadow on the significance of the move.
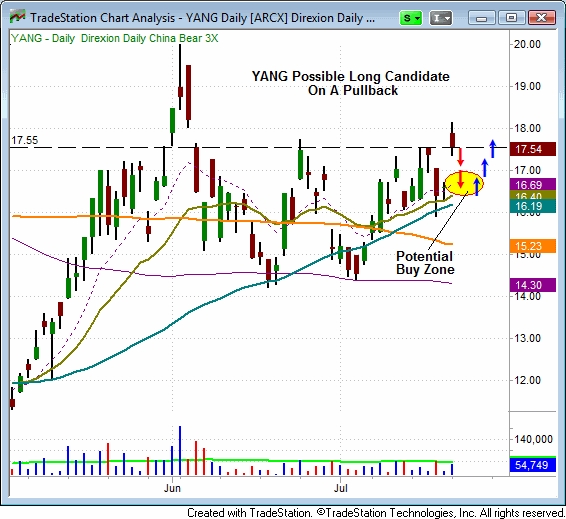
Since rallying to reclaim its 200-day moving average in mid May of this year, the Direxion Daily China Bear 3x ETF (YANG) has been consolidating in a range between fourteen and eighteen dollars. Over the past ten sessions, YANG has been holding support of its uptrending 20-day EMA. Yesterday, on a pickup in volume, this ETF gapped up and momentarily rallied above resistance of the trading range. YANG could offer a buying opportunity on a pullback into support of its 20-day EMA. We will be following this inverse ETF closely as a potential long candidate.

Despite the fact that UNG has acted well during this most recent downturn, we are not comfortable with the overall price action in the broad market. Consequently, we will be selling UNG on the open, at the market. Yesterday’s price action raises further concern that the market may be on the brink of a bigger move to the downside. The only thing preventing us from participating in a potential move lower is the lack of quality short setups. Without legitimate setups that meet our trading criteria, we will remain on the sidelines. Aggressive trading is not advised given the current market conditions.
stock commentary:
There are no new official setups for today, but we do have a few unofficial setups for experienced traders:
- EllI – entry 19.81, stop 18.78, target 20.75 – 21.00
- HW – entry 5.66, stop 5.27, target 5.95 to 6.10
These setups are unofficial because market conditions are not ideal and each reward to risk ratio is about 1 to 1. These trades are meant for a quick 1-3 day pop and if the price action follows through nicely from the trigger it is probably best to raise stop to just beneath the day’s low.
Note: AAPL reports earnings after the close on Tuesday.
If you are a new subscriber, please e-mail [email protected] with any questions regarding our trading strategy, money management, or how to make the most out of this report.
relative strength watchlist:
Our Relative Strength (or RS) Watchlist makes it easy for subscribers to import data into their own scanning software, such as Tradestation, Interactive Brokers, and TC2000. This list is comprised of the strongest 100 (or so) stocks in the market over the past six to 12 months. The scan is updated every Sunday, and this week’s RS Watchlist can be downloaded by logging in to the Members Area of our web site.