BUY
today’s watchlist (potential trade entries):

open positions:
Below is an overview of all open positions, as well as a report on all positions that were closed only since the previous day’s newsletter. Net P/L figures are based on two separate $50,000 model portfolios (one for ETFs and one for stocks). Changes to open positions since the previous report are listed in red shaded cells below. Be sure to read the Wagner Daily subscriber guide for important, automatic rules on trade entries and exits.

Having trouble seeing the open positions graphic above? Click here to view it directly on your web browser instead.
closed positions:

Having trouble seeing the closed positions graphic above? Click here to view it directly on your web browser instead.
ETF position notes:
- IBB long setup triggered.
stock position notes:
- LF long setup triggered. Closed the MT short position for a small loss.
ETF and broad market commentary:
Stocks put in a good showing on Friday as trade quickened. The Nasdaq led all indices as it tacked on a solid 1.3%. The small-cap Russell 2000 added 1.2%, while both the S&P 500 and the S&P MidCap 400 posted gains of 1.0%. The Dow Jones Industrial Average lagged slightly as it ended the day up 0.9%.
Market internals remained bullish for a second consecutive session. As might be expected on an options expiration day, turnover increased significantly. On the Nasdaq, turnover climbed by 21.0% and on the NYSE by 17.3%. Advancing volume also held the upper hand, as it topped declining volume on the Nasdaq by a factor of 4.8 to 1 and on NYSE by a factor of 4.3 to 1. Institutions were clearly involved in Friday’s price action. This resulted in both an accumulation day and a follow through day on both exchanges.
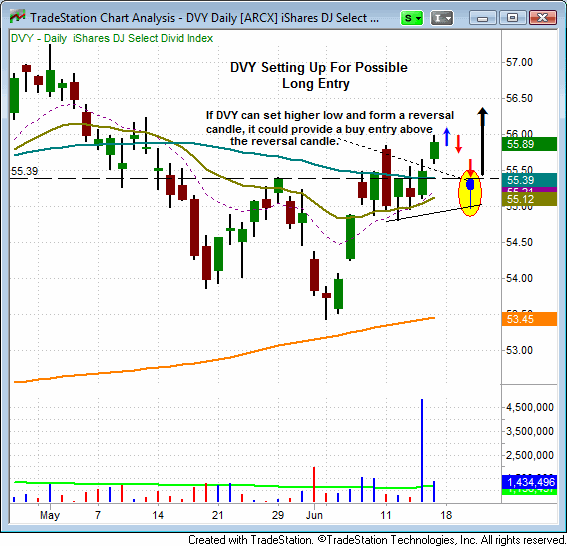
Over the past two weeks, the iShares Dow Jones Select Dividend Index (DVY) has shown relative strength, as it has been one of the few ETFs to regain support of both its 20-day EMA and 50-day MA. DVY could offer a buying opportunity if it continues to consolidate above these key marks. Ideally, we would like to see DVY form a higher low and form a reversal candle as a possible pivot point for a potential long entry. The chart below provides a visual of the hypothetical price action that we view as ideal for a possible long entry. We will continue to monitor DVY closely for a potential long entry.

Yesterday, IBB hit its trigger and we opened a long position in this ETF. Although turnover fell in IBB, it closed near session highs. Friday brought a second consecutive accumulation day to both indices. It now appears that market bulls may be gaining control of the price action. Still, the DJIA is at resistance of its 50-day MA and the S&P 500 is within 6 points of this key mark. All of the other major indices remain trapped in their respective seven day trading ranges. That being said, we simply can’t ignore last week’s quality accumulation days in the Nasdaq and S&P 500, so the overall bias is to the long side right now. However, we would not be surprised to see the market pull back and attempt to shake out longs one more time before moving substantially higher.
stock commentary:
Last Friday’s heavy volume accumulation day in the Nasdaq generated a buy signal in our timing model. We also saw big volume in the S&P 500, which helped to confirm the strong action in the Nasdaq. This buy signal is not confirmed yet, as we still need to more confirmation in the form of stocks breaking out to new highs and holding. We should also see a significant picj up in the number of stocks hitting new 52-week highs vs stocks moving to new 52-week lows. Some may argue that much of last Friday’s spike in volume was due to options expiration (and not real buying interest) and that could turn out to be true; however, that doesn’t play a big part in our decision making because we always start off with reduced position sizing when we shift in to buy mode. The main issue I have with the current buy signal is that the major averages are trading below the 50-day moving average.
We added SXCI to the watchlist along with AMLN. Please note the split stop in SXCI. We’ll continue to keep our share size small until conditions improve and we are able to lock in a few winners. If this buy signal is legit…. then the market should avoid distribution for the next few days at the very least.
If you are a new subscriber, please e-mail rick@morpheustrading.com?subject=subscriber%20question with any questions regarding our trading strategy, money management, or how to make the most out of this report.
relative strength watchlist:
Our Relative Strength (or RS) Watchlist makes it easy for subscribers to import data into their own scanning software, such as Tradestation, Interactive Brokers, and TC2000. This list is comprised of the strongest 100 (or so) stocks in the market over the past six to 12 months. The scan is updated every Sunday, and this week’s RS Watchlist can be downloaded by logging in to the Members Area of our web site.