market timing model:
Buy – Signal generated on the close of November 23 (click here for more details)
today’s watchlist (potential trade entries):

Having trouble seeing the open positions graphic above? Click here to view it directly on your web browser instead.
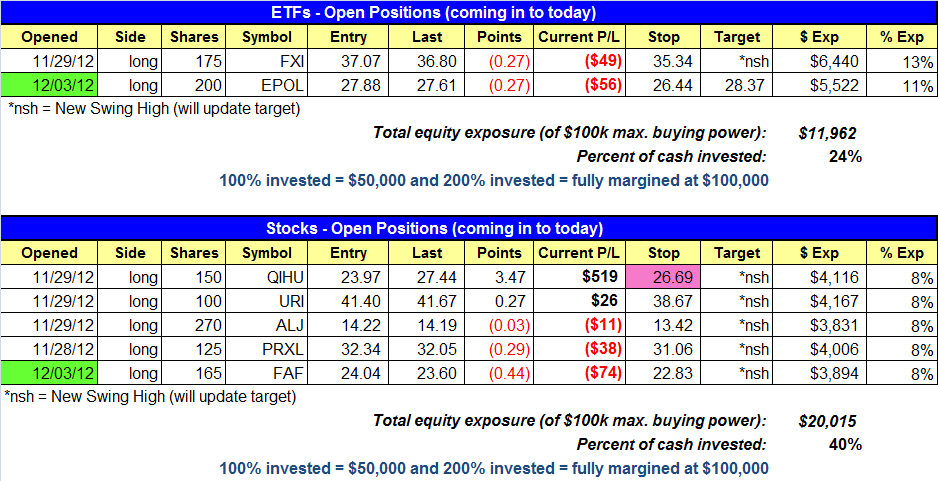
open positions:
Below is an overview of all open positions, as well as a report on all positions that were closed only since the previous day’s newsletter. Net P/L figures are based on two separate $50,000 model portfolios (one for ETFs and one for stocks). Changes to open positions since the previous report are listed in pink shaded cells below. Be sure to read the Wagner Daily subscriber guide for important, automatic rules on trade entries and exits.
Having trouble seeing the open positions graphic above? Click here to view it directly on your web browser instead.
closed positions:
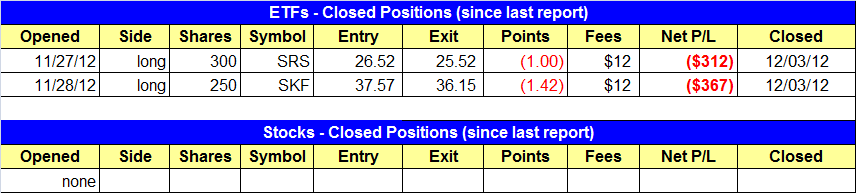
Having trouble seeing the closed positions graphic above? Click here to view it directly on your web browser instead.
ETF position notes:
- $EPOL buy entry triggered. $SKF and $SRS sell stops triggered.
stock position notes:
- $FAF buy entry triggered.
ETF and broad market commentary:
Stocks gapped higher on the open, but could not hold on to gains, as most broad market averages slid lower the rest of the session and closed near the lows of the day. Although the percent losses on the day were moderate, it was the first full of day of selling (morning and afternoon weakness) in the S&P 500 and Nadsaq Composite since the market bottomed out. The small-cap Russell 2000 shed 0.1%. The Nasdaq Composite and S&P Midcap 400 both closed lower by 0.3%, while the Dow Jones and S&P 500 both dropped 0.5%.
Total volume sank 16% on the NYSE and was 19% lighter on the the Nasdaq, allowing the major averages to avoid logging a bearish distribution day. However, it was the first time we have seen stocks fail to recover off the lows of the session by the close.
Yesterday’s failed gap up produced reversal candles on the daily charts of broad based ETFs, leading us to a new short setup in the ProShares Short Russell 2000 ($RWM), based off the chart of the Russell 2000 ETF ($IWM). The first chart below is of $IWM running in to resistance of the 50-day moving average and the prior swing high:

Monday’s reversal candle is not an ideal bearish engulfing pattern because the prior day’s action in $IWM was 1) a negative close and 2) a narrow inside day, so engulfing such a small candle is not as significant. That being said, it was a decent reversal showing stalling action at the 50-day MA and the prior swing high, giving us a low-risk entry point with a clear stop. Rather than shorting $IWM, we are using $RWM to execute the trade to include those who are unable to sell short in their account. The buy stop in $RWM is over the two-day high:

This is a second attempt to short $RWM. Although new traders are often scared to re-enter a trade is is something that should be done if the setup remains intact or there is some sort of valid re-entry point like a reversal bar.
During the recent correction, the iShares Dow Jones US Home Construction ($ITB) showed great relative strength by refusing to break the lows of its base while the S&P 500 was breaking down and setting lower highs and lows for several weeks. This pattern relative strength is easy to see on the comparison chart below:

$ITB continues to consolidate in a tight range above the rising 50-day moving average on lighter volume, wihch makes it an ideal buy candidate on a breakout above 21.00. If the market pulls back in over the next few days and $ITB follows, then we may have a low risk buy scenario develop if $ITB undecuts the 50-day MA and forms some sort of bullish reversal candle.

With the S&P 500 failing Monday’s gap up and reversing to close below the 50-day MA we could see a short-term retreat in the market. If the pullback is on lighter volume and most leading stocks and ETFs are able to hold their ground, then that would certainly be good news for the bulls and a clear sign that the rally is strengthening. If the market sells off on higher volume and leadership stocks do not hold up as well, then we may need a few more weeks of base building before there is a significant move out (assuming the market is able to hold on to recent swing lows).
stock commentary:
FAF triggered on a gap up but failed to hold above the pivot point. As mentioned yesterday, we have enough long exposure on for now, so we simply must wait and see how our stocks react to the market this week.
We are raising the stop in QIHU to lock in gains. The stop is a basic money stop just below yesterday afternoon’s low.
If you are a new subscriber, please e-mail [email protected] with any questions regarding our trading strategy, money management, or how to make the most out of this report.
relative strength combo watchlist:
Our Relative Strength Combo Watchlist makes it easy for subscribers to import data into their own scanning software, such as Tradestation, Interactive Brokers, and TC2000. This list is comprised of the strongest stocks (technically and fundamentally) in the market over the past six to 12 months. The scan is updated every Sunday, and this week’s RS Combo Watchlist can be downloaded by logging in to the Members Area of our web site.