market timing model:
Buy – Signal generated on the close of July 27 (click here for more details)
today’s watchlist (potential trade entries):

open positions:
Below is an overview of all open positions, as well as a report on all positions that were closed only since the previous day’s newsletter. Net P/L figures are based on two separate $50,000 model portfolios (one for ETFs and one for stocks). Changes to open positions since the previous report are listed in red shaded cells below. Be sure to read the Wagner Daily subscriber guide for important, automatic rules on trade entries and exits.
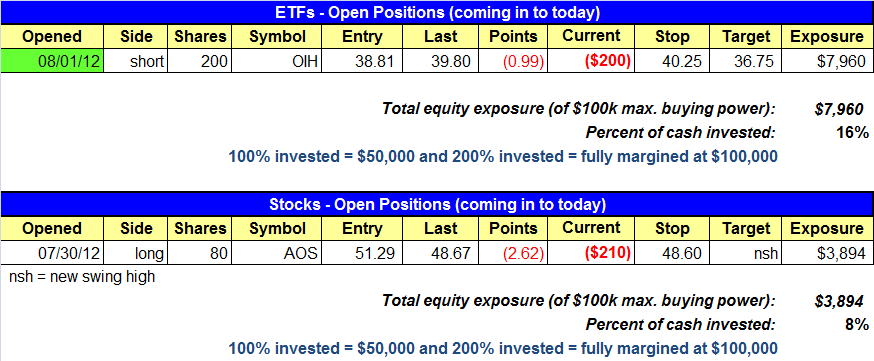
Having trouble seeing the open positions graphic above? Click here to view it directly on your web browser instead.
closed positions:

Having trouble seeing the closed positions graphic above? Click here to view it directly on your web browser instead.
ETF position notes:
- OIH short triggered.
stock position notes:
- AOS close to our stop.
ETF and broad market commentary:
Equities fell for a third consecutive day on Wednesday, on mixed trade. After showing mixed price action for much of the day, a late round of selling drug all the majer averages lower. The small-cap Russell 2000 underperformed the rest of the market by a wide margin. By the close, the small-cap index had plunged 2.0%. The S&P MidCap 400 and the Nasdaq slid by 0.9% and 0.7% respectively. The S&P 500 and the Dow Jones Industrial Average both fell 0.3% on the session.
The NYSE fell to distribution for a second consecutive session yesterday. Volume rose on the NYSE by 15.5% but fell by 3.1% on the Nasdaq. However, declining volume outpaced advancing volume on both exchanges. On the NYSE, the ratio of declining to advancing volume ended the session at 2.0 to 1. On the Nasdaq, declining volume topped advancing volume by a margin of 1.9 to 1. Due to light volume, the Nasdaq escaped distribution.
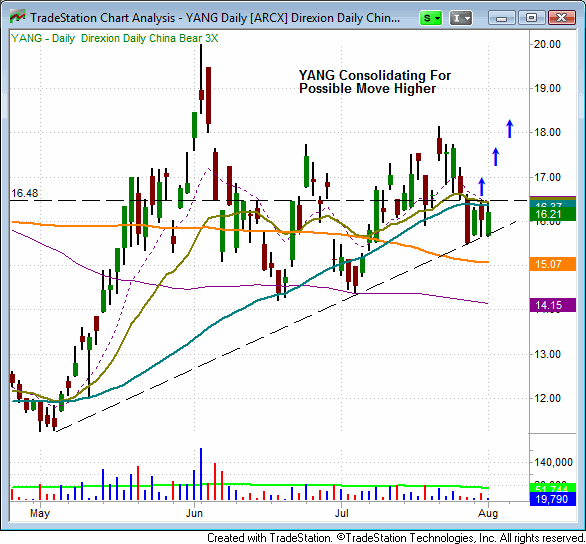
Since its pullback began on July 24th, over the past four sessions, the Direxion Daily China Bear 3x Shares ETF (YANG) has been consolidating just above its uptrend line. Over the past three sessions, YANG has unsuccessfully attempted to rally above its 20-day and 50-day moving averages each day. A move above the July 31st high of $16.48 could provide a buy entry trigger for this ETF.
OIH triggered yesterday and we opened a short position. OIH spent much of the day near session highs before falling to selling pressure into the close. The market continues to struggle and back to back distribution days on the NYSE raises concern as to market strength. Leadership remains fragmented. Ultimately, the only signal in the market that matters is price action, and the market is providing little in the way of follow through.
stock commentary:
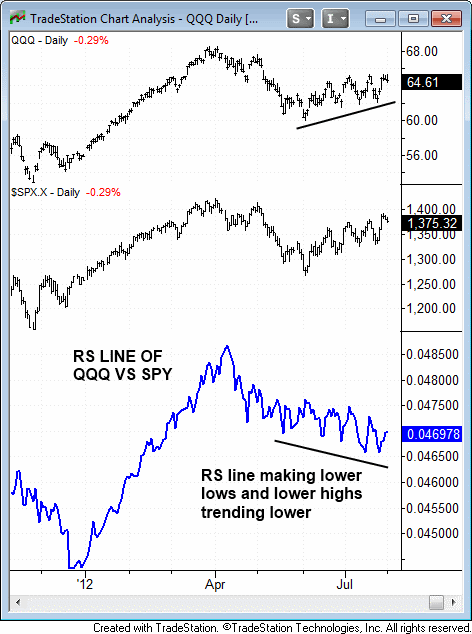
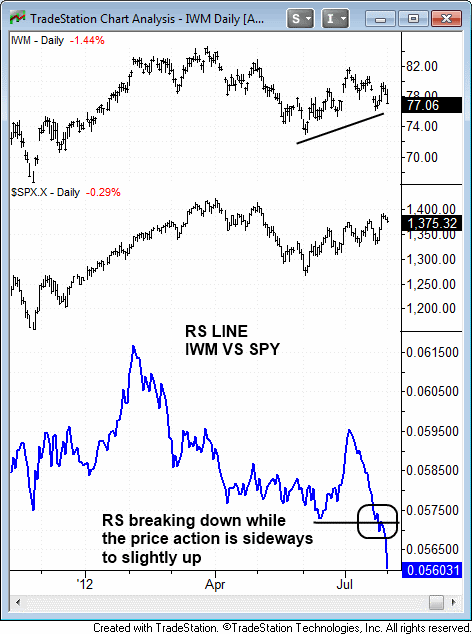
The charts below detail the weakness over the past few weeks in small and mid cap stocks, as well as large Nasdaq leadership versus the S&P 500. Note that each index is drifting sideways to slightly higher while their relative strength lines are diverging, setting lower highs and lower lows.
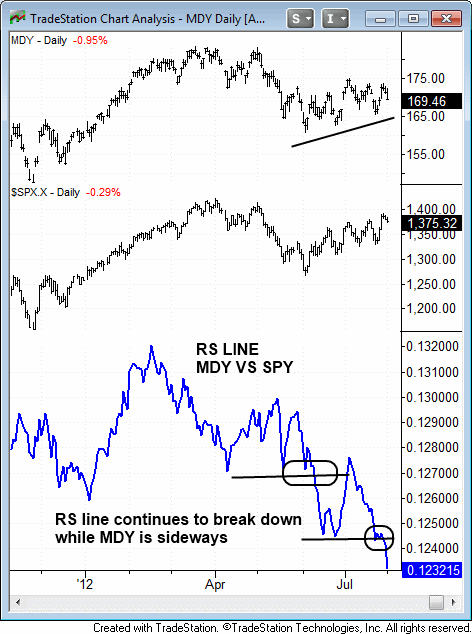
Although the S&P 500 has outperformed the other averages as of late, Wednesday’s heavy selling was the second day in a row of distribution. Two days of distribution so close to a follow through day is usually bad news for the bulls. The timing model remains in buy mode as the Nasdaq avoided distribution. The short-term plan is to continue to lay low as we have the past few weeks and patiently wait for conditions to improve while we protect our capital. We actually netted a small profit in July of just over 1% on the stock side, which is pretty good considering how unbelievably choppy the market has been.
Note: We have replaced the Relative Strength watchlist with the Relative Strength Combo watchlist. This new list combines strong price action with top fundamentals to produce ideal candidates on the long side. Stocks that make this are NOT an automatic buy. Each pattern must be examined for a low risk entry point before any action is taken. The number of stocks on this watchlist will vary depending on market conditions. This list is not a recommendation to buy.
If you are a new subscriber, please e-mail [email protected] with any questions regarding our trading strategy, money management, or how to make the most out of this report.
relative strength combo watchlist:
Our Relative Strength Combo Watchlist makes it easy for subscribers to import data into their own scanning software, such as Tradestation, Interactive Brokers, and TC2000. This list is comprised of the strongest stocks (technically and fundamentally) in the market over the past six to 12 months. The scan is updated every Sunday, and this week’s RS Combo Watchlist can be downloaded by logging in to the Members Area of our web site.