Commentary:
Stocks gapped up on the open and never looked back, as the major averages steadily pushed higher the entire session to score impressive gains across the board. We typically see strong trend days occur when the majority of investors are caught wrong footed, which may have been the case after Monday’s ugly reversal action in to the close. The strong trend day was the first clear sign of professional buying in the market since the June 2 accumulation day in the Nasdaq Composite. The Nasdaq Composite led the charge with a 2.8% gain, followed by the small-cap Russell 2000 at 2.6%. The S&P Midcap 400 and S&P 500 both advanced 2.4%. The Dow Jones Industrial Average added 2.1%. All the major indices closed at/near the highs of the day.
Turnover surged 22% on the Nasdadq and 2% on the NYSE. The higher volume gains allowed both the Nasdaq Composite and the S&P 500 to register bullish accumulation days. The strong price action was confirmed by bullish internals. Nasdaq advancing volume beat declining volume by a solid 7 to 1 margin, while NYSE a/d volume closed at an impressive 23 to 1.
The chart below shows the bullish accumulation day in the Nasdaq:
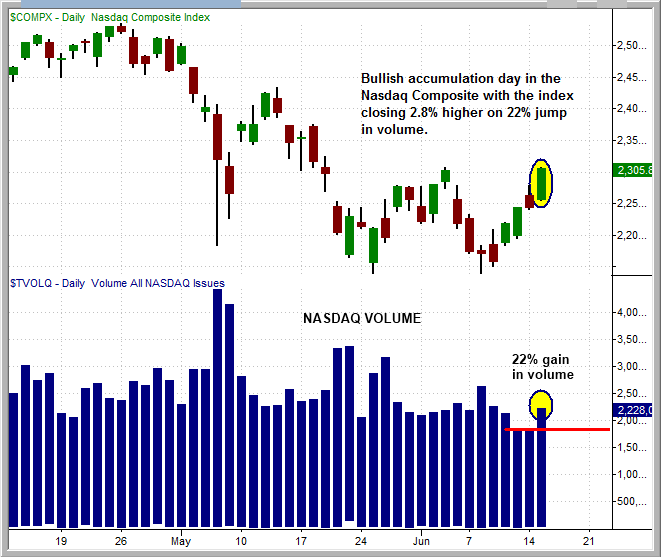
The surge in Nasdaq volume is a positive sign for the market, as it shows strong institutional demand for high flying tech stocks that usually lead the market higher when we are in rally mode. Here are a few leadership stocks to monitor over the next few weeks: BIDU, AAPL, CSTR, APKT, NFLX, THOR, ARUN, SNDK, AKAM, OVTI, RBCN, and FFIV. If these stocks continue to advance on bullish price and volume action, then the market should continue to trend higher.
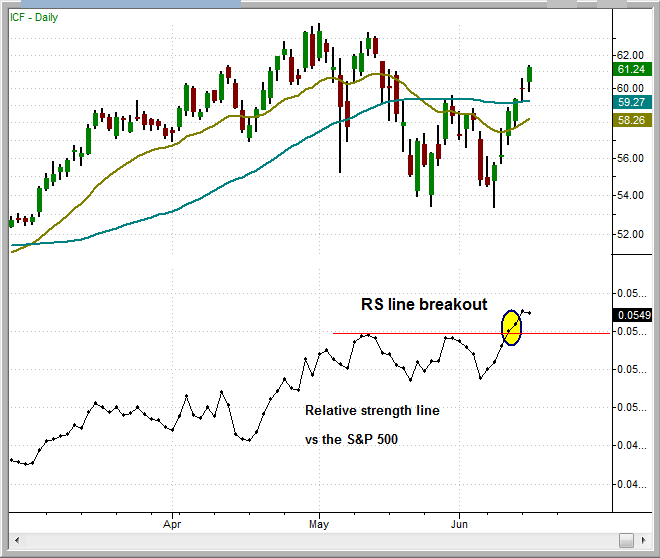
Though the Nasdaq is showing the better price and volume action, we do see pockets of relative strength on the “big board” (NYSE). The iShares Cohen & Steers REIT Index (ICF) is already trading back above its 50-day moving average. Notice the relative strength line has already broken out to new highs ahead of the price action on the chart below, which is bullish. We don’t like ICF as buy right here, but we’ll keep an eye on the action for a pullback entry at or near the 50-day moving average.
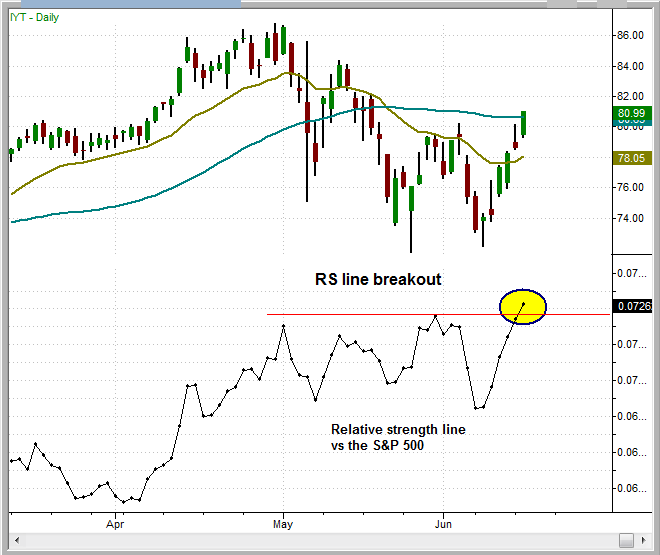
Another relatively strong performer is the iShares Transportation Index (IYT). The relative strength line in IYT has broken out to new highs well ahead of the price (just like ICF). Since IYT is straight up off the lows, we are waiting for a pullback or tight range to develop at or near the 50-day moving average to locate a low-risk buy entry.
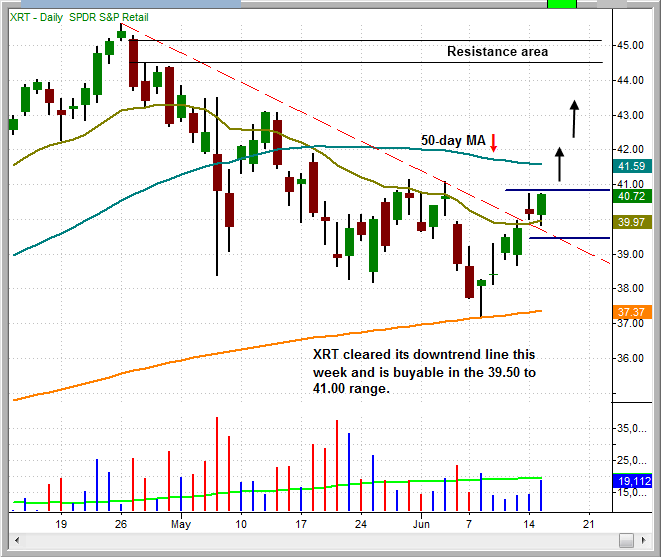
One potentially actionable buy setup is in the SPDR S&P Retail (XRT), which cleared its downtrend line and the 20-day EMA this week. If the rally in the broad market gets going, then XRT shouldn’t have much trouble pushing through the 50-day moving average. A logical exit would be at or near the prior highs around the 44.50 to 45.00 level. In terms of relative strength, XRT has held up much better than RTH and is the clear choice for establishing exposure in the retail sector.
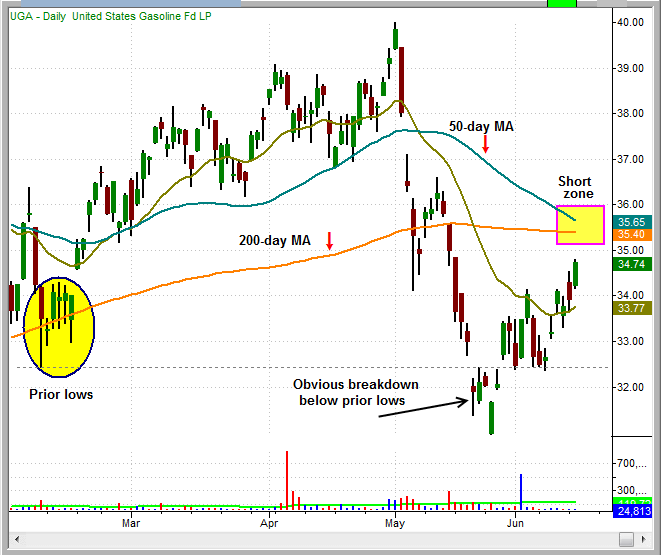
On the short side, the U.S. Oil Fund (USO) and United States Gasoline Fund (UGA) are potential short entries as they bounce into logical areas of resistance. We covered USO in yesterday’s report, so let’s go over the potential short setup in the UGA. UGA is wedging higher after a false breakdown below the prior swing lows around 33.00. Usually there is some sort of stop run after an obvious breakdown to shakeout all the late to the party shorts. We look for a move to the 50-day and 200-day MA’s that converge around 35.50 as a strong area of resistance.
In yesterday’s report we mentioned that new long entries should be entered with a very short-term time horizon unless higher volume gains (“accumulation”) start coming into the market this week. Tuesday’s strong accumulation day signals that the market may be ready to stage a meaningful advance, especially if we see another day of heavy volume accumulation.
Today’s Watchlist:
There are no new official setups this morning. We are still monitoring the U.S. Oil Fund (USO) for a potential short entry, so stay tuned for an intraday alert on the open.
Daily Performance Report:
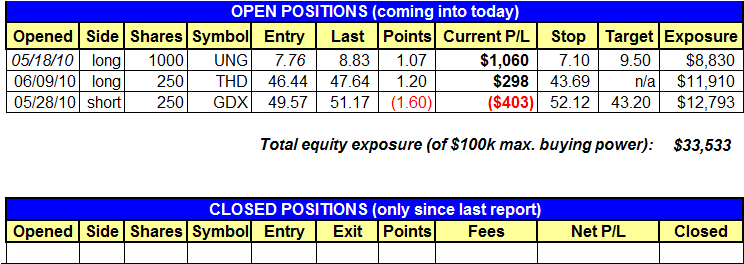
Below is an overview of all open positions, as well as a performance report on all positions that were closed only since the previous day’s newsletter. Net P/L figures are based on the $50,000 Wagner Daily model account size. Changes to open positions since the previous report are listed in red text below. Please review the Wagner Daily Subscriber Guide for important, automatic rules on trigger and stop prices.
- No changes to our open positions above.
- Reminder to subscribers – Intraday Trade Alerts to your e-mail and/or mobile phone are normally only sent to indicate a CHANGE to the pre-market plan that is detailed in each morning’s Wagner Daily. We sometimes send a courtesy alert just to confirm action that was already detailed in the pre-market newsletter, but this is not always the case. If no alert is received to the contrary, one should always assume we’re honoring all stops and trigger prices listed in each morning’s Wagner Daily. But whenever CHANGES to the pre-market stops or trigger prices are necessary, alerts are sent on an AS-NEEDED basis. Just a reminder of the purpose of Intraday Trade Alerts.
- For those of you whose ISPs occasionally deliver your e-mail with a delay, make sure you’re signed up to receive our free text message alerts sent to your mobile phone. This provides a great way to have redundancy on all Intraday Trade Alerts. Send your request to [email protected] if not already set up for this value-added feature we provide to subscribers.
Having trouble seeing the position summary graphic above?
Click here to view it directly on your Internet browser instead.
Notes:
Edited by Deron Wagner,
MTG Founder and
Head Trader