ETFs and market commentary:
Stocks ended the session mixed, as large cap issues outperformed. The Nasdaq set a fresh 52-week closing high on Tuesday as it tacked on 0.7%. The S&P 500 posted a 0.3% gain, while the DJIA eked out a 0.2% advance. The small-cap Russell 2000 and the S&P MidCap 400 were the day’s laggards as they posted losses of 0.3% and 0.2% respectively. The home construction, real estate and transportation sectors all struggled on Tuesday, while the airline, precious metal and semiconductor sectors all fared well.
Market internals ended the session mixed. Turnover slid on the NYSE by 2.4% but rose on the Nasdaq by 2.5%. However, advancing volume topped declining volume on both exchanges. By the closing bell the spread ratio stood at a plus 1.2 to 1 on the NYSE and a plus 1.6 to 1 on the Nasdaq. The Nasdaq posted an accumulation day yesterday, as the tech-rich index closed up on both higher advancing volume and total volume.
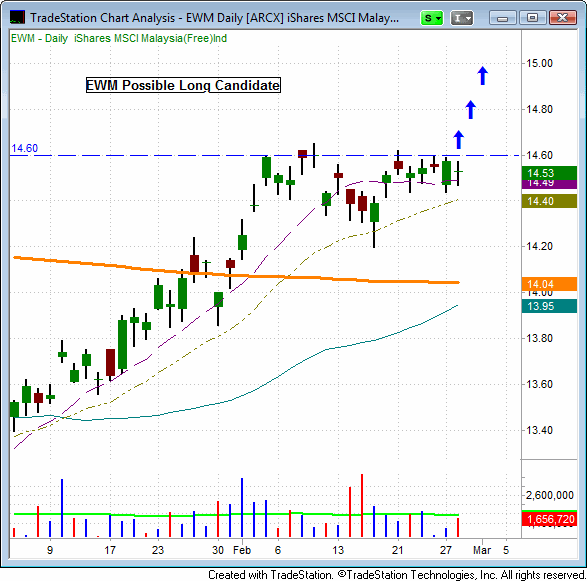
Since rallying above its 200-day MA in early February, the iShares MSCI Malaysia Index ETF (EWM) has been consolidating along its 10-day MA and 20-day EMA. This type of “base building” action is important, as it serves as the launching pad for the next potential move higher. A volume fueled move above the three day high of $14.60 could provide a buying opportunity in EWM.
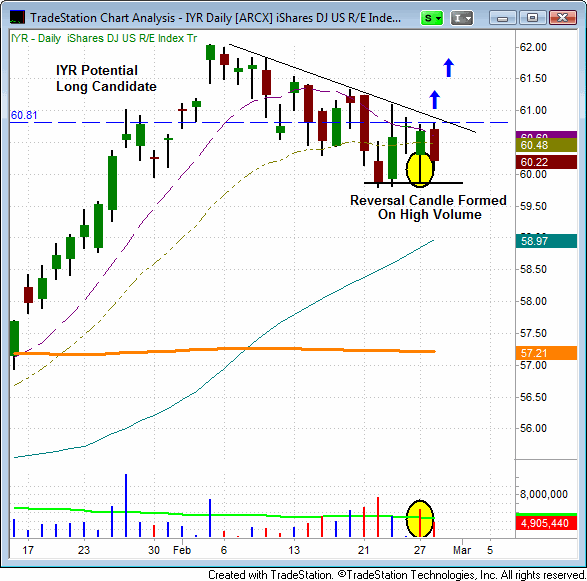
Since setting a 52-week high on February 3rd, the iShares Dow Jones US Real Estate Index ETF (IYR) has pulled back into support of its 20-day EMA. On Monday, IYR formed a distinct reversal candle on a surge in volume. Then yesterday, IYR attempted to rally above this reversal bar but instead, sold off, to close near session lows. Over the past five sessions, IYR has found resistance near $60.80 and support near $59.80. A rally above yesterday’s high of $60.80 could provide a buying opportunity in this ETF. We are placing IYR on the watchlist. For our subscribers, trade details are posted in the watchlist section of the newsletter.
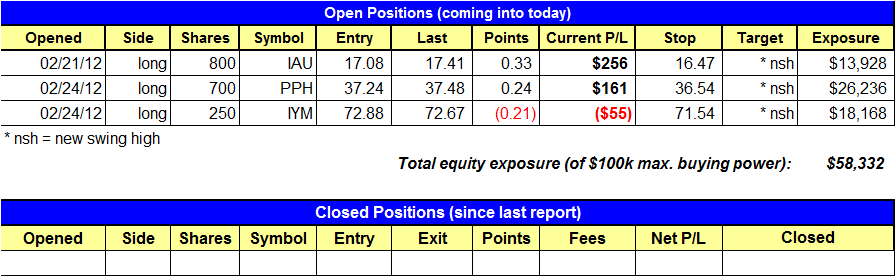
PPH broke out of its trading range yesterday, establishing a new 52-week high. IAU continued its march higher as it gapped up and rallied for most of the day. IYM showed strength in the morning session but was met with a surge of afternoon selling that left it near session lows, by the closing bell. Although the Nasdaq managed to sneak in an accumulation day, market bulls were not able to definitively wrestle control of the market. If the S&P MidCap 400 and small-cap Russell 2000 can break out of their respective trading ranges, then the market will likely see a more authoritative rally.
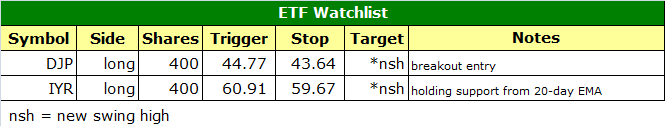
Today’s ETF Watchlist:
Daily Performance Report:
Below is an overview of all open positions, as well as a performance report on all positions that were closed only since the previous day’s newsletter. Net P/L figures are based on the $50,000 Wagner Daily model account size. Changes to open positions since the previous report are listed in red text below. Please review the Wagner DailySubscriber Guide for important, automatic rules on trigger and stop prices
Having trouble seeing the position summary graphic above? Click here to view it directly on your Internet browser instead.
Notes:
- IYR was added to the watchlist.
- Reminder to subscribers – Intraday Trade Alerts to your e-mail and/or mobile phone are normally only sent to indicate a CHANGE to the pre-market plan that is detailed in each morning’s Wagner Daily. We sometimes send a courtesy alert just to confirm action that was already detailed in the pre-market newsletter, but this is not always the case. If no alert is received to the contrary, one should always assume we’re honoring all stops and trigger prices listed in each morning’s Wagner Daily. But whenever CHANGES to the pre-market stops or trigger prices are necessary, alerts are sent on an AS-NEEDED basis. Just a reminder of the purpose of Intraday Trade Alerts.
- For those of you whose ISPs occasionally deliver your e-mail with a delay, make sure you’re signed up to receive our free text message alerts sent to your mobile phone. This provides a great way to have redundancy on all Intraday Trade Alerts. Send your request to [email protected] if not already set up for this value-added feature we provide to subscribers.
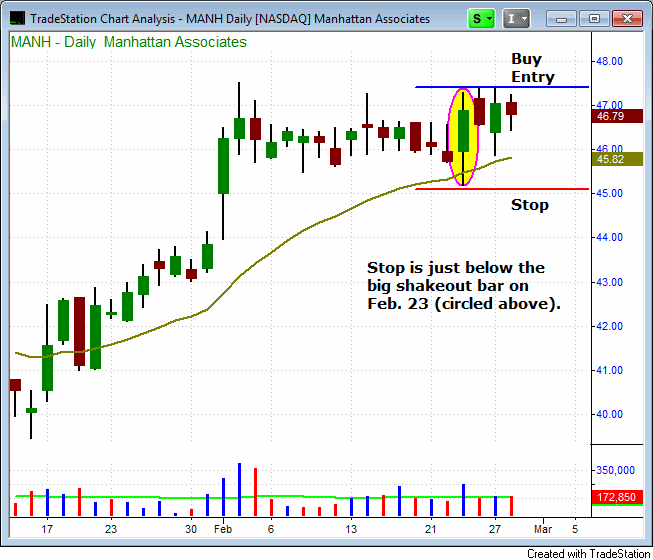
We added MANH to the stock watchlist today. We like the tight price action at the 20-day MA combined with the wide shakeout bar on 2/23:
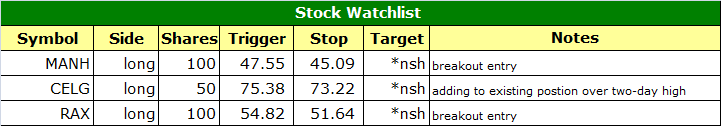
Today’s Stock Watchlist:
Daily Performance Report:
Below is an overview of all open positions, as well as a performance report on all positions that were closed only since the previous day’s newsletter. Net P/L figures are based on the $50,000 model account size. Changes to open positions since the previous report are listed in red text below.

Having trouble seeing the position summary graphic above? Click here to view it directly on your Internet browser instead.
Notes:
- IACI buy entry triggered.
Relative Strength Watchlist:
The Relative Strength (or RS) Watchlist makes it easy for subscribers to import data into their own scanning software, such as Tradestation, Interactive Brokers, and TC2000. The list is comprised of the strongest 100 (or so) stocks in the market over the past six to 12 months. The scan is based on the following criteria and is updated every Monday:
- Stock is in a well defined uptrend, trading above both the 50-day and 200-day moving averages, with the 50-day moving average above the 200-day moving average (both moving averages should be in an uptrend as well).
- Today’s close is less than 20% off the 52-week high
- Close is greater than $5.
- Volume is greater than 200,000 shares per day (using a 50-day volume moving average).
Click here to view this week’s Relative Strength Watchlist in excel
Click here to view this week’s Relative Strength Watchlist as a text file