Confirmed Buy– Signal generated on the close of January 22 (click here for more details)
today’s watchlist (potential trade entries):

Having trouble seeing the open positions graphic above? Click here to view it directly on your web browser instead.
open positions:
Below is an overview of all open positions, as well as a report on all positions that were closed only since the previous day’s newsletter. Net P/L figures are based on two separate $50,000 model portfolios (one for ETFs and one for stocks). Changes to open positions since the previous report are listed in pink shaded cells below. Be sure to read the Wagner Daily subscriber guide for important, automatic rules on trade entries and exits.

Having trouble seeing the open positions graphic above? Click here to view it directly on your web browser instead.
closed positions:
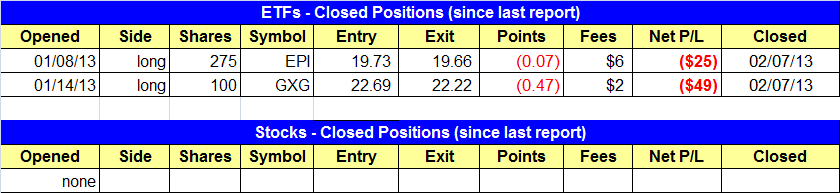
Having trouble seeing the closed positions graphic above? Click here to view it directly on your web browser instead.
ETF position notes:
- Stopped out of $EPI and $GXG.
stock position notes:
- Note the $LNKD setup is a buy at the market.
ETF, stock, and broad market commentary:
Stocks sold off sharply in the morning session with most averages down about 1.0% by 11:30 am. However, as we have seen several times during the current rally, buyers were willing to step in on weakness, lifting the market well off the lows of the session by the close. Losses in the major averages were limited to the -0.1% to -0.4% range. Volume increased on the NYSE, but since the S&P 500 closed down less than 0.2% there was no distribution.
We have seen some rotation as late, with a few stocks and ETFs pulling back sharply the past few days, such as $EWI, $EWP, and $FXI. But overall, leadership stocks have held up well and the market has been quite resilient in fighting off distribution. We continue to see a dry up in buy setups, but that is to be expected at some point with many stocks and ETFs extended from the January run up.
We canceled the $ITB and $EEM setups for now, but we will continue to monitor the action for a logical entry point. We stopped out of $EPI near break-even. $GXG stopped us out of our remaining 100 shares.
In yesterday’s report we listed $EWJ as a buy entry but we did not officially enter because our buy stop triggered within the first 5-minutes of trading. We ignored the original entry and placed a new buy stop 2 cents above the 5-minute high (10.11 was new buy entry). Our buy entry remains at 10.11, but please note that we will not use the 5-minute rule again on Friday. If the setup triggers on the open we are buying ASAP. The 5-minute rule is to keep us out of trouble with false triggers, but since $EWJ has closed above the $10.00 buy pivot for two days we know that it is not a false trigger.
After breaking out from a tight-seven month long consolidation, the Guggenheim Shipping ETF ($SEA) has pulled back to the 20-day EMA during the past few weeks. The weekly chart below details the tight consolidation around 16.00:

Dropping down to the daily chart, we see the 50-day MA now trading above the 200-day MA and trending higher, which is a bullish trend reversal signal. After an orderly pullback, the price action looks to have found support at the 20-day EMA. We are placing $SEA on the watchlist with a buy entry above the two-day high. We are starting off with partial size and will look to add to the position on a breakout above the highs of the current range.

On the stock side we have one new setup in $LNKD. $LNKD reacted favorably to earnings after the close on Thursday, closing above 130.00 in after hours trading. We plan to buy $LNKD on the open using the chart of $RIMM (now $BBRY) below as our guide.

So we are basically looking for $LNKD to gap up and hold..then follow through to the upside.

We plan to buy 30 shares of $LNKD (about an 8% position) at market on the open IF the open is at or above 130.00, but below $150.00. So $130 to $150 is the buy zone. The stop will simply be 8% below our entry price.
If you are a new subscriber, please e-mail [email protected] with any questions regarding our trading strategy, money management, or how to make the most out of this report.
relative strength combo watchlist:
Our Relative Strength Combo Watchlist makes it easy for subscribers to import data into their own scanning software, such as Tradestation, Interactive Brokers, and TC2000. This list is comprised of the strongest stocks (technically and fundamentally) in the market over the past six to 12 months. The scan is updated every Sunday, and this week’s RS Combo Watchlist can be downloaded by logging in to the Members Area of our web site.