Confirmed Buy– Signal generated on the close of January 22 (click here for more details)
today’s watchlist (potential trade entries):

Having trouble seeing the open positions graphic above? Click here to view it directly on your web browser instead.
open positions:
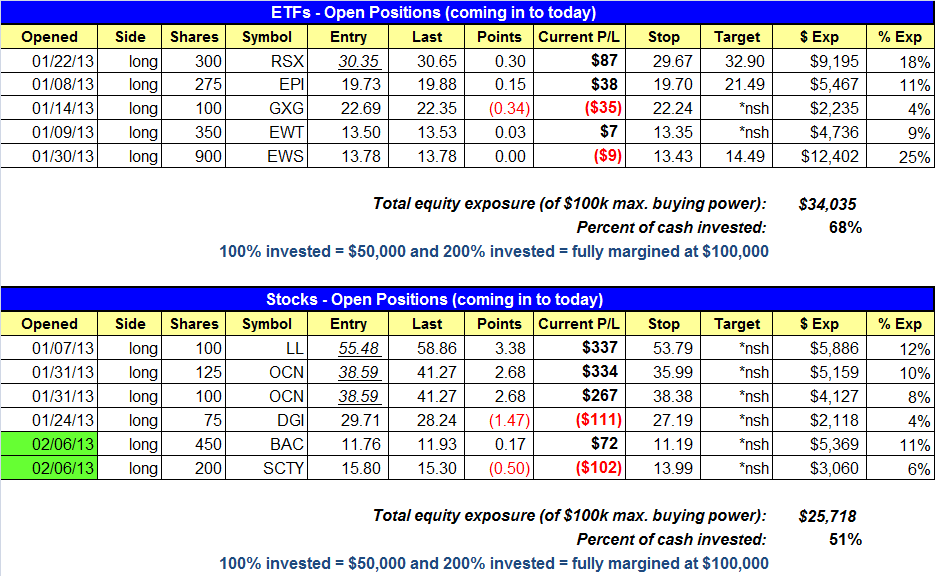
Below is an overview of all open positions, as well as a report on all positions that were closed only since the previous day’s newsletter. Net P/L figures are based on two separate $50,000 model portfolios (one for ETFs and one for stocks). Changes to open positions since the previous report are listed in pink shaded cells below. Be sure to read the Wagner Daily subscriber guide for important, automatic rules on trade entries and exits.

Having trouble seeing the open positions graphic above? Click here to view it directly on your web browser instead.
closed positions:

Having trouble seeing the closed positions graphic above? Click here to view it directly on your web browser instead.
ETF position notes:
- $KOL sell stop triggered and we are out.
stock position notes:
- $BAC and $SCTY buy entries trigggered.
ETF, stock, and broad market commentary:
After getting off to a lower start, stocks reversed higher throughout the first half of the session, pulled back after mid-day, then grinded back towards their intraday highs into the close. In the end, the main stock market indexes finished the choppy session within 0.1% of the flat line. Although it was an indecisive round of trading, it was positive that stocks held onto the previous day’s gains. However, lower volume across the board showed a lack of commitment amongst banks, mutual funds, hedge funds, and other institutions. But as we have mentioned in past reports, accumulation days are not as important once a broad market rally has built enough momentum.
There are a few new official buy setups on today’s watchlist above. $KOL stopped us out of our remaining shares yesterday. We see no reason to re-enter right now, as the price must first climb back above $25.00 and set a higher low.
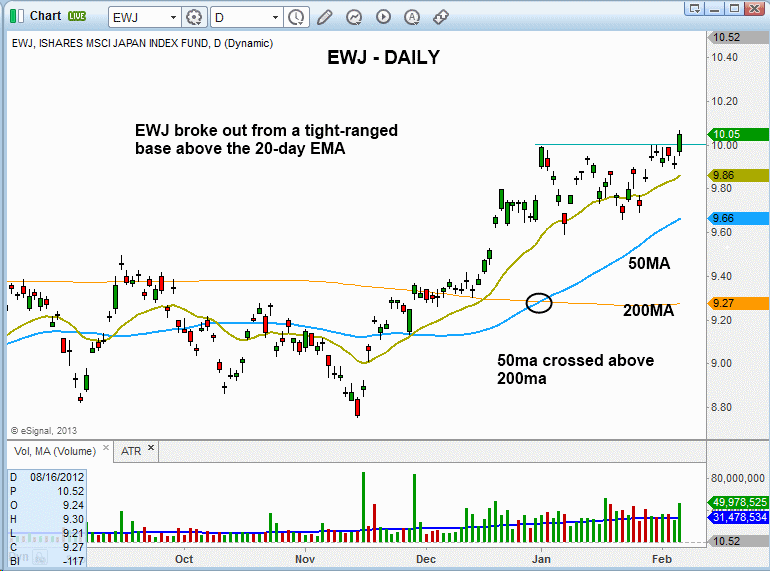
iShares MSCI Japan ($EWJ) broke out from a four week base on a pick up in volume Wednesday.

The price action held above the rising 20-day EMA while setting higher lows within the base. Note that the 50-day MA has crossed above the 200-day MA and is now in a clear uptrend, signaling that momentum on the daily chart is beginning to build. Our buy entry is over Wednesday’s high. If the entry triggers within the first 5-minutes of trading, then the 5-minute rule will apply. Please add 2 cents to the 5-minute high as the official entry. We are not going with our usual 10 cents above the 5-minute high because $EWJ’s ATR is only 10-13 cents.
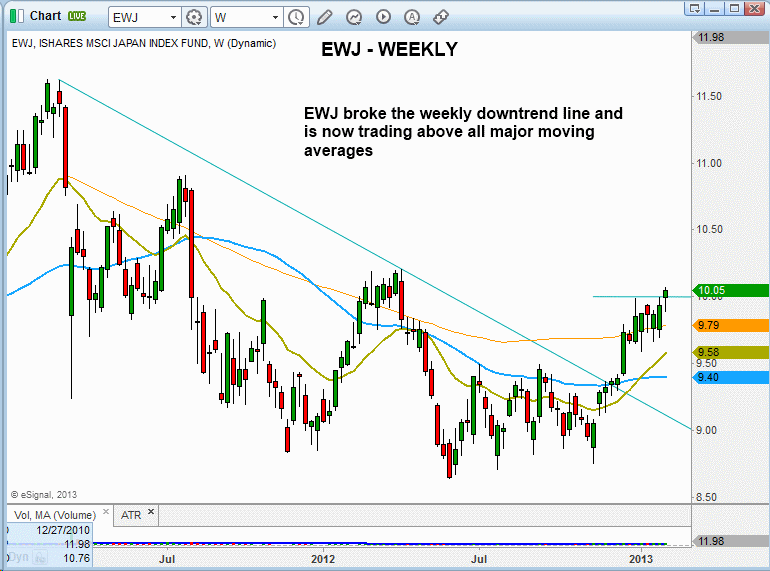
The weekly chart of $EWJ puts the recent breakout into perspective. After clearing the downtrend line and breaking above the base at the lows (around 9.50), $EWJ rallied and stalled out just below the highs of 2012. The current consolidation is the first true base off the lows. We look for the price action to hold above 10.00 and test the swing high of July (2011), which is around 11.00.

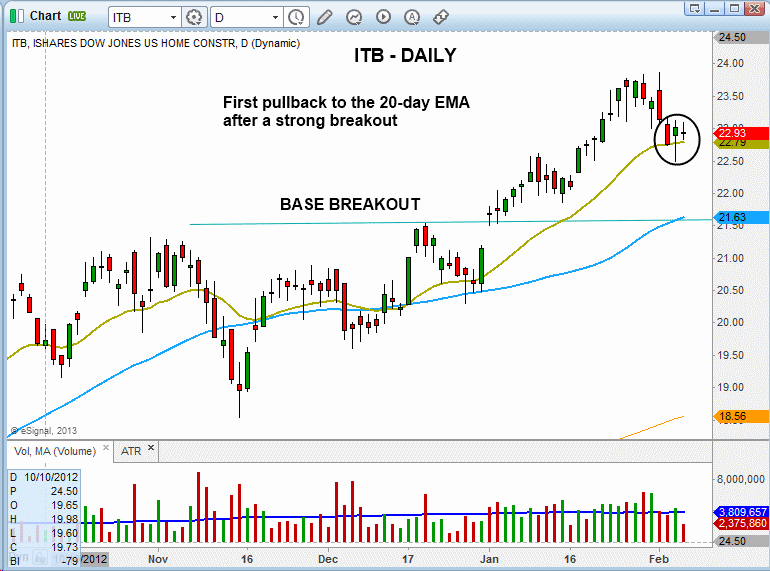
After a strong base breakout at 21.50, iShares Dow Jones US Home Construction ($ITB) has pulled back to the 20-day EMA. The 20-day EMA is usually a good place to locate low risk pullback entries, as all strong breakouts should continue to trade above the 20-day EMA in an uptrend. A clear break of the 20-day EMA would mean that the uptrend is in danger of reversing, or at the very least the price action may need a few weeks of basing before going higher.

Our buy entry in $ITB is over Wednesday’s reversal candle high. The stop is placed just below the swing low of January 15 to give the setup a little room to breathe, but the action should hold above the 20-day EMA once triggered.
We added two new positions on the stock side yesterday in $BAC and $SCTY. We were able to enter on a slight pullback at the open in $BAC with a buy limit order. We plan to add to the position on a breakout above the range high or slightly lower…if possible.
$SCTY opened strong, but sold off the rest of the day and closed well off the highs of the session. We must be patient here, as the price action could recover in a few days and take out Wednesday’s high. $SCTY is a big mover, so if the setup holds we could be in great shape once it gets going.
If you are a new subscriber, please e-mail [email protected] with any questions regarding our trading strategy, money management, or how to make the most out of this report.
relative strength combo watchlist:
Our Relative Strength Combo Watchlist makes it easy for subscribers to import data into their own scanning software, such as Tradestation, Interactive Brokers, and TC2000. This list is comprised of the strongest stocks (technically and fundamentally) in the market over the past six to 12 months. The scan is updated every Sunday, and this week’s RS Combo Watchlist can be downloaded by logging in to the Members Area of our web site.