Current signal generated on close of July 11 (current portfolio exposure should at least be 75% to 100% or more if you can go on margin.)
Past signals:
- Neutral signal generated on close of July 5
- Sell signal generated on close of June 24
today’s watchlist (potential trade entries):

Having trouble seeing the open positions graphic above? Click here to view it directly on your web browser instead.
open positions:
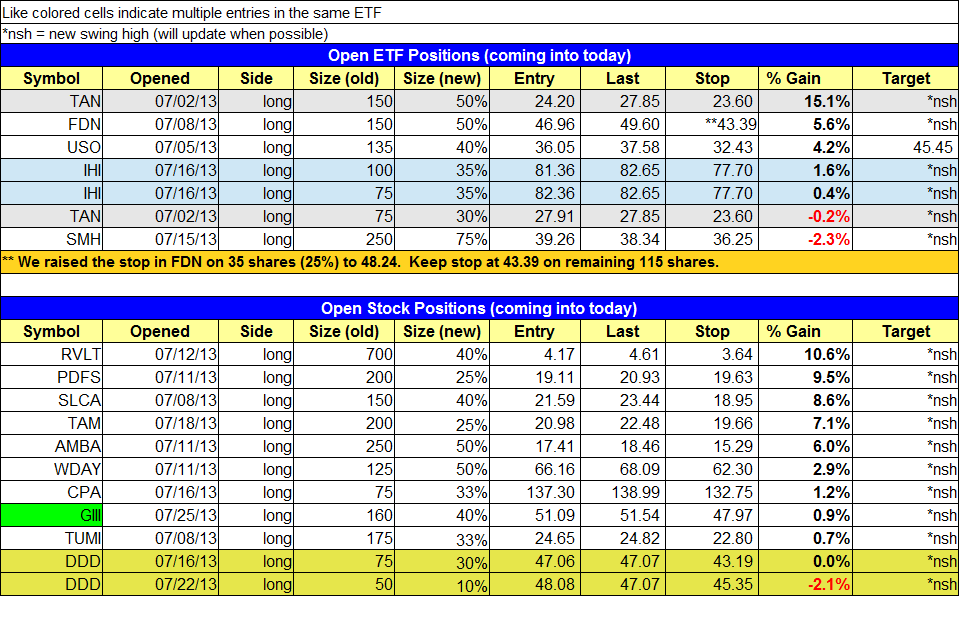
Below is an overview of all open positions, as well as a report on all positions that were closed only since the previous day’s newsletter. Changes to open positions since the previous report are listed in pink shaded cells below. Be sure to read the Wagner Daily subscriber guide for important, automatic rules on trade entries and exits. Click here to learn the best way to calculate your share size.

Having trouble seeing the open positions graphic above? Click here to view it directly on your web browser instead.
closed positions:

Having trouble seeing the closed positions graphic above? Click here to view it directly on your web browser instead.
ETF position notes:
- Sold 25% of $USO at our stop.
stock position notes:
- Bought $GIII.
ETF, stock, and broad market commentary:
After several bouts of distribution within the past week, the Nasdaq snapped back to life yesterday. A 16% increase in turnover accompanied a 0.7% price gain in the Nasdaq Composite, enabling the tech-heavy index to score a bullish “accumulation day” indicative of institutional buying. Action in the rest of the major indices was more subdued. The benchmark S&P 500 and blue-chip Dow Jones Industrial Average rose just 0.3% and 0.1% respectively. Total volume in the NYSE was slightly lighter than the previous day’s level.
In the July 8 issue of The Wagner Daily, we pointed out iShares Japan Index ($EWJ) as a potential swing trade on the long side. At the time, $EWJ had recovered back above both its 20 and 50-day moving averages, after undergoing a 13% correction from the highs of May 2013.
$EWJ gained approximately 4% over the following two weeks, as the index began working its way back to its prior highs. Now, $EWJ has pulled back to new horizontal price support of its early July breakout, thereby providing us with a low-risk swing trade buy entry. The setup is shown on the daily chart of $EWJ below:

As you can see, $EWJ gapped down to “undercut” support of its 20-day exponential moving average (beige line) yesterday. More significant support of its 50-day moving average (teal line) lies just below.
From here, we anticipate a quick recovery back above yesterday’s high, which would put $EWJ back above its 20-day EMA as well. If that happens, we will buy the ETF with the expectation that the next leg up will enable $EWJ to break out to a fresh multi-year high and resume its dominant uptrend that has been in place throughout most of 2013.
Because most international ETFs (like $EWJ) realize most of their gains in the form of opening gaps due to overseas trading, please note we will NOT be using the 5-minute opening gap rules for this trade setup. As long as $EWJ trades above our buy stop price, we will buy it (even if it gaps more than 1.3% above the entry). Please see the “watchlist” section of today’s report for our exact entry and exit prices of this trade setup.
The iShares Commodity-Indexed Trust ($GSG) is another ETF we are stalking for potential buy entry today, although the technical setup is different. Unlike $EWJ, which has already been in a steady uptrend for most of the year and is now recovering from a correction, $GSG is a potential trend reversal buy setup.
Starting with the longer-term weekly chart timeframe, notice that $GSG has been forming a pennant-like chart pattern since early 2012:

Since March of 2012, there have been four touches of the upper channel resistance of the downtrend line that forms the pennant. Each successive test of that downtrend line increases the likelihood of the price breaking out above the downtrend line, particularly as the pattern tightens. Furthermore, notice that lower channel support of the pennant corresponds to the formation of two “higher lows,” which is also positive.
Next, let’s zoom into the shorter-term daily chart timeframe to see why we like this trade setup for partial buy entry now:

As shown on the chart above, $GSG perfectly pulled back to kiss major support of both its 20 and 200-day moving averages yesterday. The convergence of these moving averages makes the support more substantial as well. After yesterday’s (July 25) intraday low coincided with the moving average support, $GSG reversed to close at its intraday high, thereby forming a bullish “hammer” candlestick pattern as well.
Because $GSG has not yet broken out above the downtrend line that forms the pennant, a buy entry at the current price level is a bit early. However, we are comfortable taking partial share size (starter position) with a buy stop just above yesterday’s high. The combination of the 20 and 200-day moving average convergence, the “hammer” candlestick, and the fact that it will be the fifth touch of the downtrend line provides for a very positive reward-risk ratio on the trade setup; the stop can be placed just below the July 25 low, while the target is all the way up in the area of the March 2012 high.
On the stock side, GIII triggered its buy entry but volume was below average. We’d like to see heavy volume come in to $GIII if/when it climbs above $52.00. $PDFS broke out to new highs on heavy volume. Our stop looks to be in the right spot, beneath the three day low.
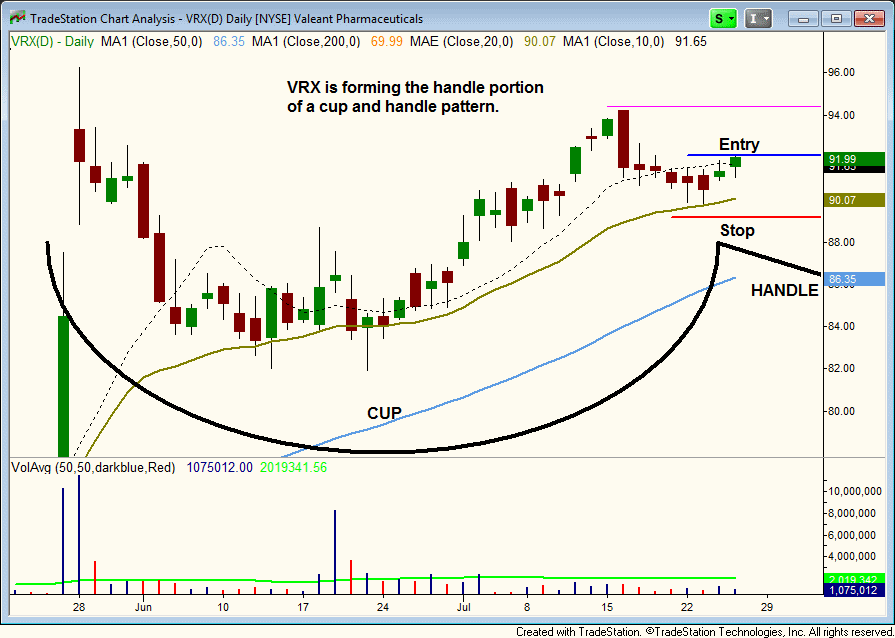
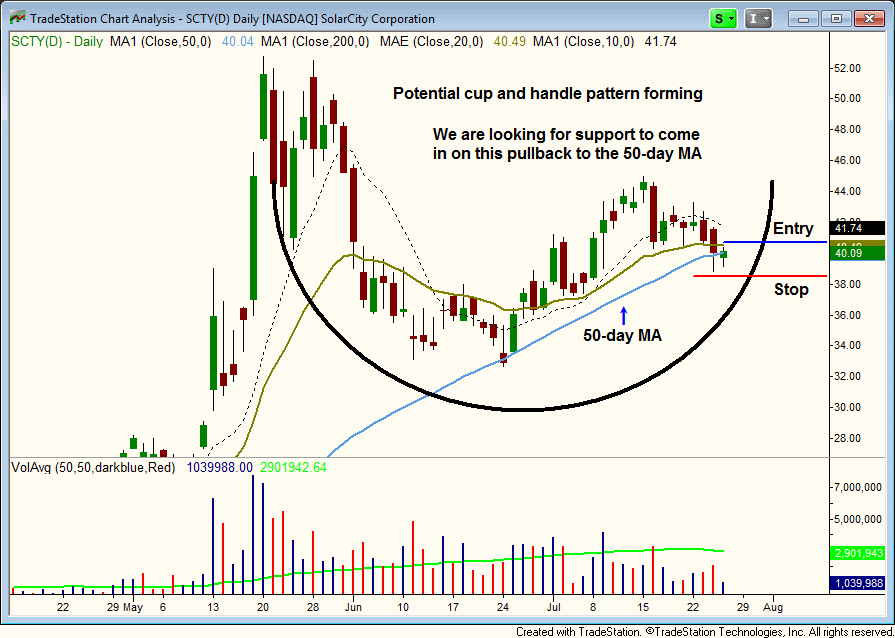
We have a few new setups on today’s watchlist in $VRX, $SCTY, and $MNKD. There is no chart for the $MNKD setup.
Valeant Pharmaceuticals ($VRX) has formed a cup and handle pattern at the highs. It is currently forming the handle portion of the pattern, pulling off the swing high on the right side. The pullback has found support at the rising 20-day EMA. Our buy entry is over yesterday’s high. Note that the 5-minute rule will not apply, as $VRX has already closed above the high of 7/23 (which is the trigger point for a long entry). Earnings is on 8/2, so we are taking a half position. If $VRX moves higher, then we will hold the position through earnings. If it basically chops around and we are long, then we will cut our size down to 1/4 or 1/3 before the report.

SolarCity Corporation ($SCTY) has also formed a cup and handle type pattern, with the current pullback possibly forming a lower handle, just above the 50-day MA. $SCTY also reports earnings soon (on 8/7), so we are going with reduced size and a tight stop, looking for the price action to move out right away.
