market timing model:
BUY (click here for more details)
today’s watchlist (potential trade entries):

open positions:
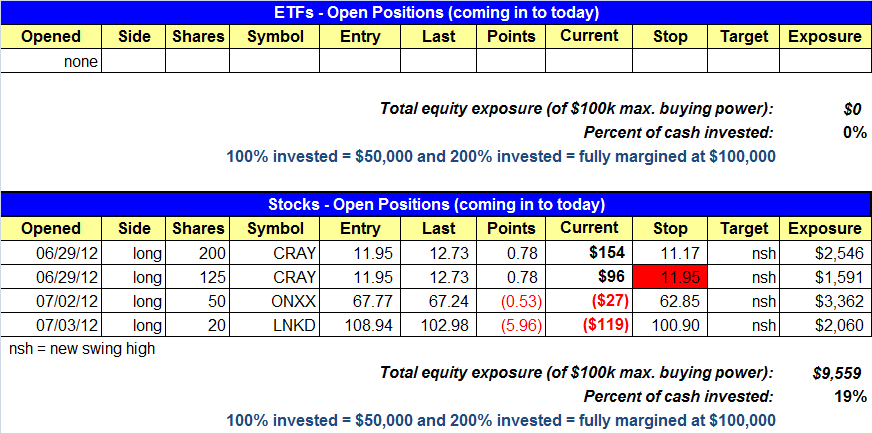
Below is an overview of all open positions, as well as a report on all positions that were closed only since the previous day’s newsletter. Net P/L figures are based on two separate $50,000 model portfolios (one for ETFs and one for stocks). Changes to open positions since the previous report are listed in red shaded cells below. Be sure to read the Wagner Daily subscriber guide for important, automatic rules on trade entries and exits.

Having trouble seeing the open positions graphic above? Click here to view it directly on your web browser instead.
closed positions:

Having trouble seeing the closed positions graphic above? Click here to view it directly on your web browser instead.
ETF position notes:
- Closed UNP at market on the open for a scratch loss.
stock position notes:
- No trades were made.
- CRAY is listed twice in the open positions section due to the split stop.
ETF and broad market commentary:
In an uneventful session, stocks moved modestly lower on Monday, on slightly higher trade. The Dow Jones Industrial Average, S&P MidCap 400 and the small-cap Russell 2000 all closed down 0.3%. The Nasdaq and the S&P 500 both shed 0.2%. Stocks did however, close well off session lows.
Market internals were negative on Monday. Volume was up 0.2% on the Nasdaq and 5.2% on the NYSE. Declining volume topped advancing volume on the NYSE by 2.1 to 1 and on the Nasdaq by 1.5 to 1. Although market internals were modestly bearish yesterday, we would be hard pressed to label the session as a distribution day for Wall Street.
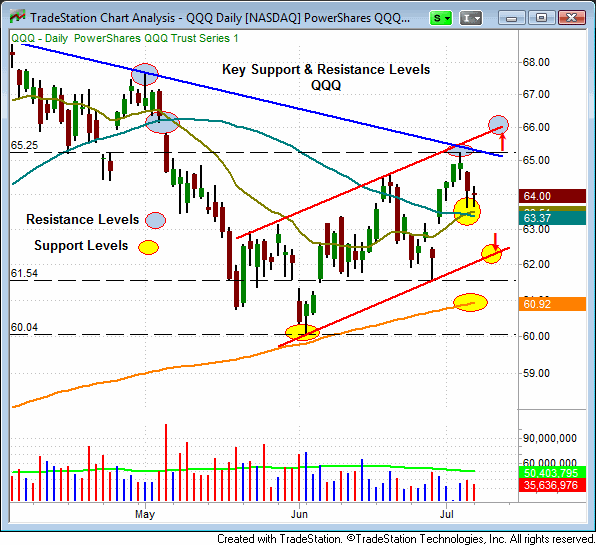
Since the market appears to be in consolidation mode, it’s probably a good time to do a review support and resistance levels in the broad market. The following chart of the Powershares Nasdaq Trust (QQQ) shows that the price action in this ETF has been contained by a tight trend channel (Red lines) since the June 4th swing low. Trend channels provide an excellent gauge for determining support and resistance levels. The trend channel suggests that QQQ should find support near $62.40 and resistance near $66.00. Other key support levels include the convergence of the 20-day and 50-day moving averages ($63.30 – $63.50), the 200-day moving average ($60.92), the June 28th swing low ($61.54) and the June 4th swing low ($60.04).

The SPDR S&P 500 (SPY) has also formed a trend channel similar to the QQQ. The next important resistance levels on the SPY are the July 3rd swing high ($37.51) and the upper trend line of the trend channel (Red up arrow near $139.00). Key support levels for the SPY include the convergence of the 20 and 50 day moving averages ($134.00 to $134.40), the lower trend channel line near $133.20, the June 25th swing low ($130.85), the 200-day MA ($130.52) and the June 4th swing low of $127.14.

As is evidenced by the charts of the QQQ and the SPY, both of these ETFs, and by extension the broad market, have a considerable number of both support and resistance levels. This suggests that we could remain in a trading range throughout the summer. In the absence of big volume, it is generally difficult for the market to make a significant move out of a range. Consequently, we wouldn’t be surprised to see a lack of significant movement in the broad market, during the low volume summer doldrums.
stock commentary:
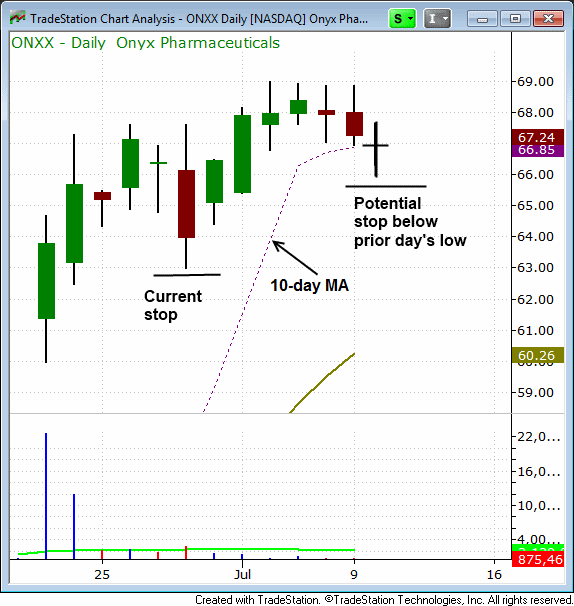
We tightened up the stop on just over 1/3 of the position in CRAY to reduce our risk. We may soon be raising the stop in ONXX if/when it tests the 10-day moving average. The chart below details how ONXX could play out over the next two days. If ONXX closes below the 10-day MA we will raise our stop to just below the low of that day.

There are no new official setups for today. Unofficially, SGEN and AVD are potential buy setups. SGEN on a breakout above the range high and AVD on a move above the two-day high. As mentioned yesterday, we are going to lay low for a few days and see how our stocks react to the market.
If you are a new subscriber, please e-mail [email protected] with any questions regarding our trading strategy, money management, or how to make the most out of this report.
relative strength watchlist:
Our Relative Strength (or RS) Watchlist makes it easy for subscribers to import data into their own scanning software, such as Tradestation, Interactive Brokers, and TC2000. This list is comprised of the strongest 100 (or so) stocks in the market over the past six to 12 months. The scan is updated every Sunday, and this week’s RS Watchlist can be downloaded by logging in to the Members Area of our web site.