market timing model:
Confirmed Buy – Signal generated on the close of September 4 (click here for more details) (we are on a buy signal from the close of Aug. 16)
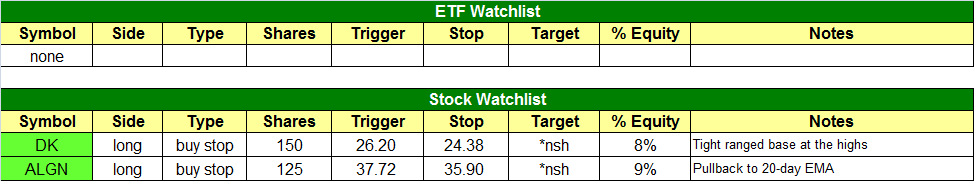
today’s watchlist (potential trade entries):
Having trouble seeing the open positions graphic above? Click here to view it directly on your web browser instead.
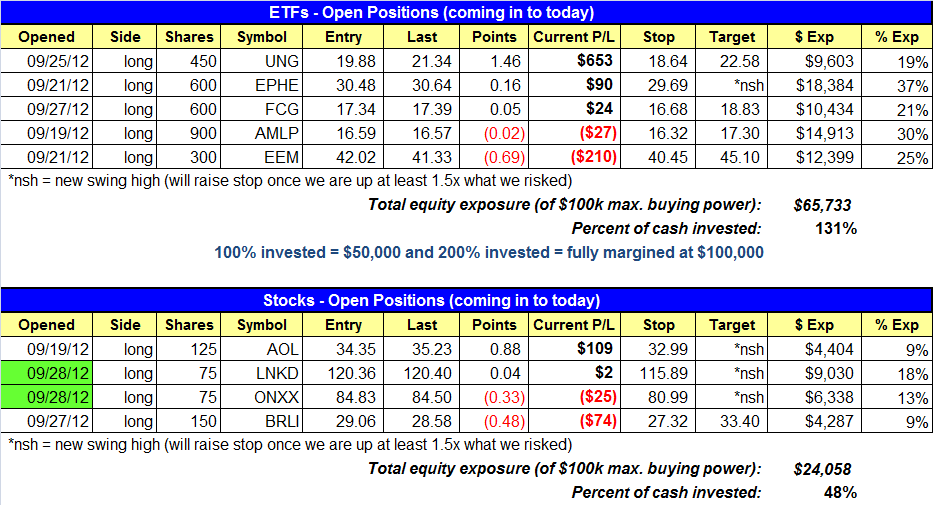
open positions:
Below is an overview of all open positions, as well as a report on all positions that were closed only since the previous day’s newsletter. Net P/L figures are based on two separate $50,000 model portfolios (one for ETFs and one for stocks). Changes to open positions since the previous report are listed in pink shaded cells below. Be sure to read the Wagner Daily subscriber guide for important, automatic rules on trade entries and exits.
Having trouble seeing the open positions graphic above? Click here to view it directly on your web browser instead.
closed positions:

Having trouble seeing the closed positions graphic above? Click here to view it directly on your web browser instead.
ETF position notes:
- No new trades were made.
stock position notes:
- ONXX and LNKD longs triggered. Note that ONXX triggered on the open as a buy limit order (not a buy stop).
ETF and broad market commentary:
The US stock market finished the third quarter of 2012 in uneventful fashion and with a bit of indecision. The major indices gapped lower on the open, found support and edged their way higher into mid-day, then drifted back down into the close. The Dow Jones Industrial Average ($DJIA) fell 0.4%, the S&P 500 Index ($SPX) 0.5%, and the Nasdaq Composite ($COMPX) 0.7%. Mid-cap stocks showed relative strength, as the S&P MidCap 400 ($MID) slipped only 0.3%, but the small-cap Russell 2000 ($RUT) lost 0.7%. Closing near their opening prices, the main stock market indexes finished near the middle of their intraday trading ranges.
Turnover ticked higher across the board, causing both the S&P and Nasdaq to register a bearish “distribution day.” Total volume in the NYSE rose 10%, while volume in the Nasdaq was 4% higher than the previous day’s level. In the NYSE, declining volume exceeded advancing volume by a margin of approximately 3 to 1. The ADV/DEC volume ratio in the Nasdaq was negative by less than 3 to 2. Whenever the S&P or Nasdaq decline on higher volume, it is indicative of selling among banks, mutual funds, hedge funds, and other institutional players, and is known as a “distribution day.” Last Friday’s session was the second such session of distribution in recent weeks. Within the course of a steady market uptrend, one or two “distribution days” over a 3-4 week period is normal and can typically be absorbed by a healthy market. Nevertheless, the instance of four or more days of institutional selling within the same period is usually enough to cause an intermediate-term uptrend to end. As such, will be on alert for any further sessions of higher volume selling in the coming week.
As we enter the last quarter of 2012, let’s take an updated look at the technical daily chart pattern of the S&P 500 SPDR ($SPY), a popular ETF proxy for the benchmark S&P 500 Index:

As annotated on the daily chart above, notice that $SPY is presently trying to cling to near-term support of its 20-day exponential moving average (the beige line). In a strong uptrend, this moving average often acts perfectly as support for enabling an index, ETF, or stock to resume its uptrend (assuming a firm uptrend is already in place). As an example of this, notice how the 20-day exponential moving average perfectly acted as support in late August (point “A”). As such, we will be looking for signs of whether or not SPY holds near its current price and starts to head back up in the coming days.
Even if SPY breaks below last week’s lows, the good news for bulls is that much more significant technical price support will be found near the rising 50-day moving average, which is now converging with new horizontal price support from the prior highs of April and May of this year (point “B”). Remember that one of the most basic tenets of technical analysis states a prior level of price resistance will become the new support level, after the resistance is broken. Therefore, if $SPY corrects further (down to the $142 area), it should find major support that will provide for very low risk buy entries on ETFs and stocks with the most relative strength to the broad market. Both the Nasdaq Composite and Dow Jones Industrial Average have similar daily chart patterns to the S&P 500, with the latter showing a bit more relative strength.
With the broad market in pullback mode and our model ETF trading portfolio already positioned in five different ETFs, we’re not in a hurry to enter any new positions in the coming days. Of our five open ETF positions,three of them are presently showing an unrealized gain, with one of our positions now nearing its upside profit target ($UNG). Since these positions have a low correlation to the direction of the broad market, they have been holding up well during the broad market’s current pullback. Still, there is no rush to assume additional risk exposure until the major indices prove they will find support near current price levels. Just to keep you updated, strong ETFs currently on our radar screen for possible near-term buy entry include the following tickers: $EWW, $EWH, $XRT, $ITB, and $KRE. As always, we will be sure to let you know our exact entry, stop, and target prices if we add any of these ETFs to our “official” watchlist in the coming days/weeks.
stock commentary:
It’s usually a good sign when a stock prints a new 52-week closing high as AOL did on Friday. However, when volume is curiously light and does not confirm the move it can often lead to a sharp reversal/ false breakout. We do not cut the position right away, but if volume is higher the next day with a lower close (a distribution day in AOL), then we may decide to cut the position or trail a very tight stop.

We have two new buy setups on today’s watchlist. Hopefully the two stocks we entered on Friday can power higher so that we can take a quick 10-15% gain. If the market decides to go nowhere for a while we may have to wait until the meat of earnings season (late October) to provide a catalyst for the next move out, provided that the market remains healthy.
If you are a new subscriber, please e-mail [email protected] with any questions regarding our trading strategy, money management, or how to make the most out of this report.
relative strength combo watchlist:
Our Relative Strength Combo Watchlist makes it easy for subscribers to import data into their own scanning software, such as Tradestation, Interactive Brokers, and TC2000. This list is comprised of the strongest stocks (technically and fundamentally) in the market over the past six to 12 months. The scan is updated every Sunday, and this week’s RS Combo Watchlist can be downloaded by logging in to the Members Area of our web site.