market timing model:
Sell – Signal generated on the close of October 12 (click here for more details)
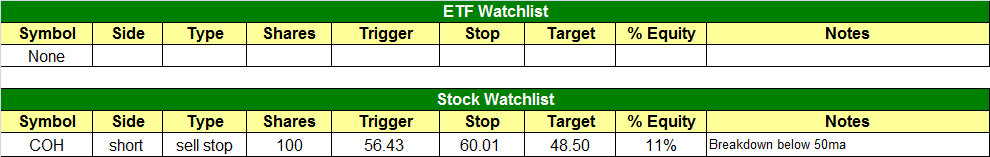
today’s watchlist (potential trade entries):
Having trouble seeing the open positions graphic above? Click here to view it directly on your web browser instead.
open positions:
Below is an overview of all open positions, as well as a report on all positions that were closed only since the previous day’s newsletter. Net P/L figures are based on two separate $50,000 model portfolios (one for ETFs and one for stocks). Changes to open positions since the previous report are listed in pink shaded cells below. Be sure to read the Wagner Daily subscriber guide for important, automatic rules on trade entries and exits.
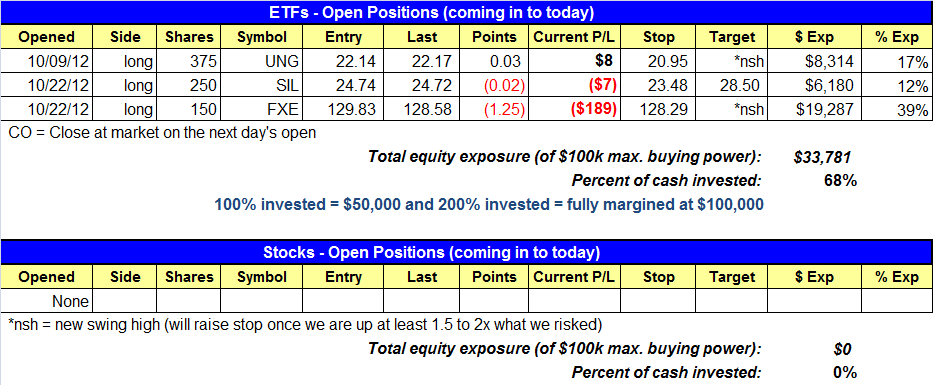
Having trouble seeing the open positions graphic above? Click here to view it directly on your web browser instead.
closed positions:

Having trouble seeing the closed positions graphic above? Click here to view it directly on your web browser instead.
ETF position notes:
- No trades were made.
stock position notes:
- No trades were made.
ETF and broad market commentary:
Like the previous day, stocks open substantially higher yesterday morning, but the bulls immediately took control and sold into strength of the opening gap. The major indices trended steadily lower until mid-day, “undercut” their previous day’s lows, then bounced and traded sideways throughout the remainder of the session. The S&P 500 Index ($SPX) rose 0.3%, as both the Nasdaq Composite ($COMPX) and Dow Jones Industrial Average ($DJIA) edged 0.2% higher. The small-cap Russell 2000 Index ($RUT) and S&P Midcap 400 Index ($MID) advanced 0.4% and 0.2% respectively. Despite the modest gains across the board, the S&P and Dow only closed near the middle of their intraday trading ranges. The Nasdaq again closed near its session low.
Total volume in the NYSE was 4% higher than the previous day’s level, while turnover in the Nasdaq receded by 4%. Volume in both the NYSE and Nasdaq remained above 50-day average levels. In both exchanges, advancing volume was only fractionally higher than declining volume. Overall, yesterday’s price to volume relationship in the broad market did not provide any clear indication of stealth institutional buying, nor further selling. Traders were likely on the sidelines ahead of the highly anticipated quarterly earnings report of $AAPL, which was due after yesterday’s close (the initial after-hours reaction to the subsequent report was relatively muted).
As we have been saying the past few days, our focus is now on finding ETFs that are breaking down, then looking for short selling entry points on a substantial bounce into resistance. In yesterday’s ETF analysis, we pointed out PowerShares QQQ Trust ($QQQ), which tracks the Nasdaq 100 Index, as one such ETF we are stalking for potential short entry on a bounce. Additionally, we are targeting specific industry sector ETFs that are breaking down as well. One such ETF on our radar screen for potential short entry in the coming days is iShares Nasdaq Biotechnology ($IBB). The annotated daily chart is shown below:

As little as a month ago, IBB was actually a leading ETF that had been showing relative strength to the broad market throughout all of 2012. However, when market conditions rapidly deteriorate, former leading ETFs and stocks often correct to a greater degree than the broad market. In the case of IBB, the recent correction off its highs has been ugly, and we believe the ETF will correct substantially lower in the near to intermediate-term. For short selling, a downside target that “undercuts” the rising 200-day moving average is realistic, as the longer-term weekly chart shows substantial support from the prior base of consolidation just below the $128 area.
As thoroughly explained in yesterday’s newsletter, accurate timing for entry points is even important on the short side of the market. Again, rather than selling short the initial move lower (very risky), we prefer to wait for the first substantial bounce that follows a key breakdown below an obvious level of support. With IBB, we are looking for a bounce that tests new resistance of the 50-day moving average (the teal line). The 20-day exponential moving average is now sloping sharply lower as well, and should soon form a bearish crossover below the 50-day moving average. This would provide additional resistance.
If IBB provides us with the bounce are looking for, we will then look to sell short on the first bearish reversal bar or opening gap down that follows. Given that the broad market may technically be due for a bounce in the coming days, we anticipate IBB to bounce as well. As always, we will list our exact entry, stop, and target prices for this trade setup on our “official” watchlist if/when IBB provides us with an ideal short selling entry point. The same goes for QQQ (or the inversely correlated flavors as well).
stock commentary:
$COH is a short setup from our Former Leaders Watchlist. The criteria for this watchlist is:
- Must have been a true market leader during a signficant rally.
- The move from the lows to absolute high is anywhere from 300-500% or more (this could be less if the stock is a bigger cap issue like NKE).
- Must be heavily owned by institutions.
- Must be a very liquid stock.
- The price action has not set a new high in the last 2-3 months.
- Must be trading at or around the 50-day moving average (ideally the 50-day MA is no longer sloping higher).
We are simply looking for stocks that have made their run, are no longer leading the market higher, and are now breaking down because most institutions want out.
The short entry in $COH is below yesterday’s low with a stop above the high of the shakeout bar on 10/23 which was in reaction to earnings.

Other than COH, most stocks on the short watchlist are not in play because they report earnings soon or are oversold in the short-term. We will continue to remain patient and wait for new setups to emerge.
If you are a new subscriber, please e-mail [email protected] with any questions regarding our trading strategy, money management, or how to make the most out of this report.
relative strength combo watchlist:
Our Relative Strength Combo Watchlist makes it easy for subscribers to import data into their own scanning software, such as Tradestation, Interactive Brokers, and TC2000. This list is comprised of the strongest stocks (technically and fundamentally) in the market over the past six to 12 months. The scan is updated every Sunday, and this week’s RS Combo Watchlist can be downloaded by logging in to the Members Area of our web site.