Confirmed Buy
– The timing model was upgraded to a confirmed buy on the close of January 22. However, the initial buy signal was generated on the close of December 31. (click here for more details)
today’s watchlist (potential trade entries):

Having trouble seeing the open positions graphic above? Click here to view it directly on your web browser instead.
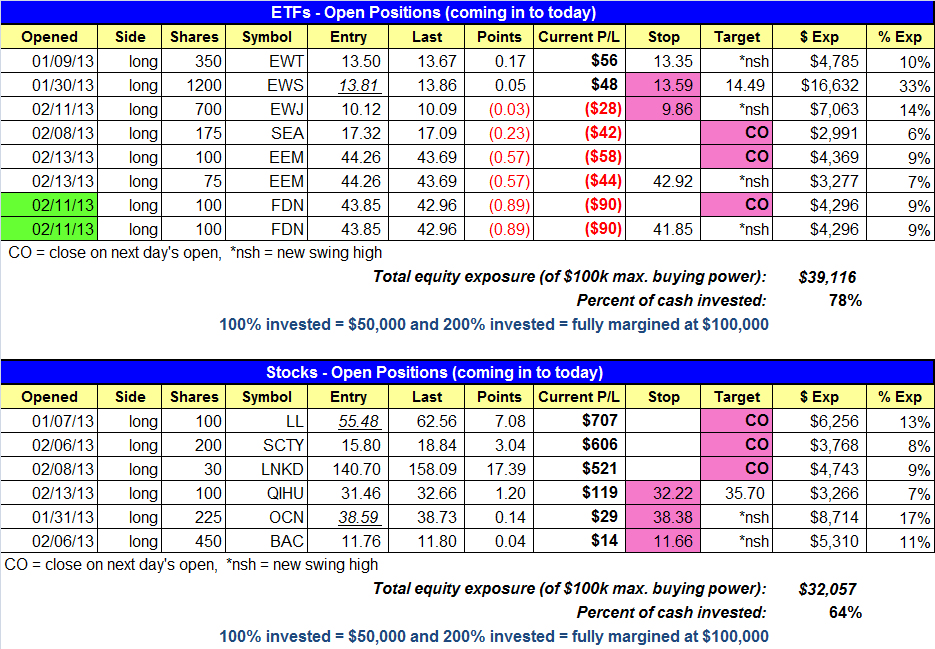
open positions:
Below is an overview of all open positions, as well as a report on all positions that were closed only since the previous day’s newsletter. Net P/L figures are based on two separate $50,000 model portfolios (one for ETFs and one for stocks). Changes to open positions since the previous report are listed in pink shaded cells below. Be sure to read the Wagner Daily subscriber guide for important, automatic rules on trade entries and exits.
Having trouble seeing the open positions graphic above? Click here to view it directly on your web browser instead.
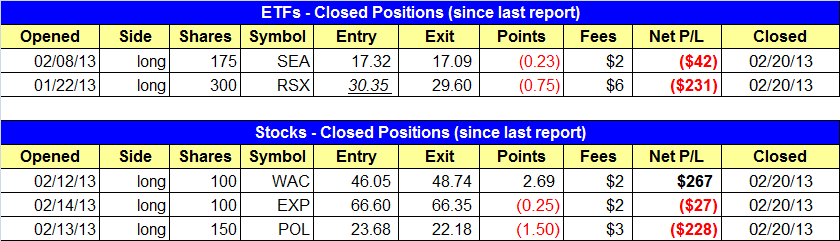
closed positions:
Having trouble seeing the closed positions graphic above? Click here to view it directly on your web browser instead.
ETF position notes:
- $SEA and $RSX triggered sell stops. $DIG and $TAN buy stops have been canceled.
stock position notes:
- $WAC, $EXP, $POL sell stops triggered.
ETF, stock, and broad market commentary:
Stocks suffered their first substantial round of losses in weeks yesterday, as a negative reaction to the Fed’s last policy meeting gave traders a good excuse to sell and lock in profits from the current uptrend. The S&P 500 and Nasdaq Composite declined 1.2% and 1.5% respectively. Blue chips held up the best, as the Dow Jones Industrial Average lost 0.8%. The major indices closed at their dead lows of the day, indicating the bears firmly had control for a change.
Of more importance than the actual percentage losses was that the selloff was accompanied by higher volume across the board. Turnover in both the NYSE and Nasdaq registered 8% higher than the previous day’s levels. The higher volume losses caused both the S&P and Nasdaq to register a bearish “distribution day” that was indicative of selling amongst banks, mutual funds, hedge funds, and other institutions.
Wednesday’s heavy selling was a clear warning sign to take some profits off the table and raise cash. Our market timing model remains in buy mode. That being said, we are not looking to initiate new positions on Thursday. We are content to manage existing positions and see how the market responds to yesterday’s plunge. One or two more distribution days by next Friday would certainly force the model into sell mode.
Energy, financial, and construction stocks fueled the rally in the S&P 500 the past two months. ETFs from these groups put in ugly reversal bars on Wednesday. $KBE and $XES printed bearish reversal candles, while $ITB broke down on higher volume. The price action in these ETFs indicate that the S&P 500 may soon need a few weeks of rest.
As mentioned above, SPDR KBW Bank ($KBE) closed with a bearish engulfing pattern on Wednesday. The candle was pretty wide, covering about six sessions worth of price action.

The reversal is a clear warning signal for short to intermediate-term traders to lock in some profits, as the price action may need a few weeks of rest before it heads much higher.
Along with leading ETFs breaking down, we have seen some disappointing action in Chinese ETFs of late. The iShares FTSE/Xinhua China 25 Index ($FXI) failed to hold support of the uptrending 50-day MA this week and is breaking down below a recent swing low.

For ETFs and stocks that we are tracking, we keep an internal watchlist of setups that are moving in the right direction, meaning that they are above the 50-day MA and setting higher lows within a base. We removed $FXI from our top watchlist today, as it is no longer above the 50-day or setting higher swing lows. It looks like $FXI will need a few weeks of base building before it can produce a reliable entry point.
As mentioned above, our focus right now is on managing existing positions. On the stock side, we plan to take profits on the open to lock in solid gains in $LNKD, $LL, and $SCTY. $LL stalled after earnings and $SCTY put in a false breakout, so locking in gains seems logical right now. We raised the stop on a few other positions to minimize losses.
If you are a new subscriber, please e-mail [email protected] with any questions regarding our trading strategy, money management, or how to make the most out of this report.
relative strength combo watchlist:
Our Relative Strength Combo Watchlist makes it easy for subscribers to import data into their own scanning software, such as Tradestation, Interactive Brokers, and TC2000. This list is comprised of the strongest stocks (technically and fundamentally) in the market over the past six to 12 months. The scan is updated every Sunday, and this week’s RS Combo Watchlist can be downloaded by logging in to the Members Area of our web site.