market timing model: Neutral
Current signal generated on close of November 6.Portfolio exposure can be anywhere from 0% to 50% long depending on how individual setups are holding up. You may have on more long exposure if you feel really good about your positions and they are deep in the money.Past signals:
- Buy signal generated on close of September 9
- Neutral signal generated on close of August 15
- Buy signal generated on close of July 11
- Neutral signal generated on close of July 5
- Sell signal generated on close of June 24
today’s watchlist (potential trade entries):

Having trouble seeing the open positions graphic above? Click here to view it directly on your web browser instead.
open positions:
Below is an overview of all open positions, as well as a report on all positions that were closed only since the previous day’s newsletter. Changes to open positions since the previous report are listed in pink shaded cells below. Be sure to read the Wagner Daily subscriber guide for important, automatic rules on trade entries and exits.

Having trouble seeing the open positions graphic above? Click here to view it directly on your web browser instead.
closed positions:
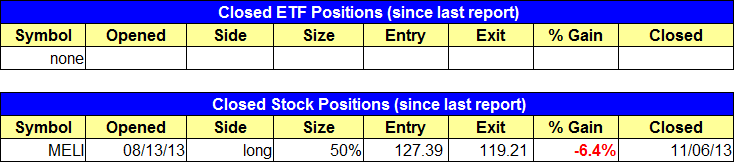
Having trouble seeing the closed positions graphic above? Click here to view it directly on your web browser instead.
ETF position notes:
- Canceled the $DLS trade due to large gap up on open. Bought $SKYY and $FAS.
stock position notes:
- Added to $KORS.
ETF, stock, and broad market commentary:
Stocks closed in mixed territory yesterday. The Russell 2000 and NASDAQ Composite underperformed, while the Dow Jones led with a 0.8% gain that produced a breakout to new highs.
Turnover eased on the NYSE but picked up on the NASDAQ, producing a distribution day on the NASDAQ Composite. By our count, this is the 6th distribution day in the past three weeks. We have four days of churning (higher volume stalling action), plus two more days of heavy volume with a lower close (see chart below).
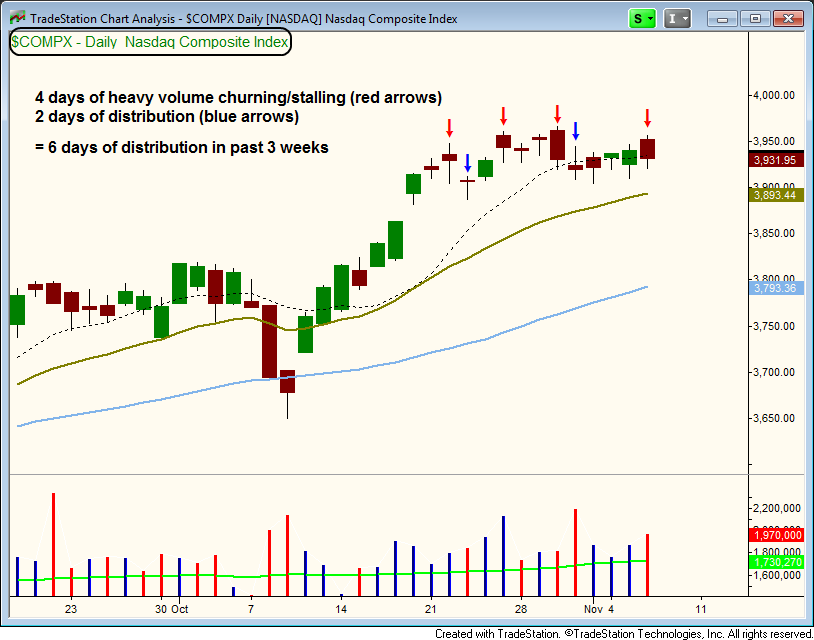
The high distribution count is a concern, but does not trigger a sell signal in our timing model by itself. Unfortunately, leading stocks have been lagging the broad market averages for a few weeks now and many were hit hard on Wednesday.
$TSLA and $MELI were TKO’d yesterday, dropping 15% and 10% respectively after reporting earnings. $SCTY tanked 14% in after hours trading (post earnings). Below is a list of a few leadership stocks that took a hit.
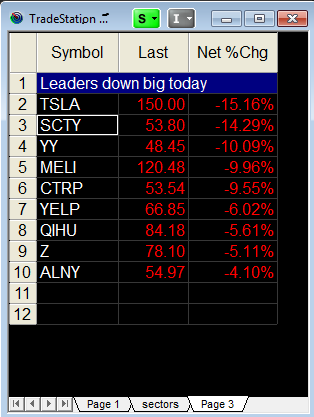
$LNKD, which was not on the list above, has already broken down below the 50-day MA and could potentially test the 200-day MA in the next few weeks.
The combination of weakness in leadership stocks and bearish distribution count in the NASDAQ, has forced our timing model into neutral mode. We are not yet going with a full sell signal because all major averages are still in a clear uptrend and well above the 50-day MA.
However, the fact that major averages are leading, and leading stocks are lagging is something we simply can’t ignore. Rather than try to stick with open positions and overstay our welcome, we are going with very tight stops on existing positions that are in the money. We are also exiting positions “at the market” on Thursday’s open that were recently entered, as late entries tend to get hit the hardest when conditions turn sour.
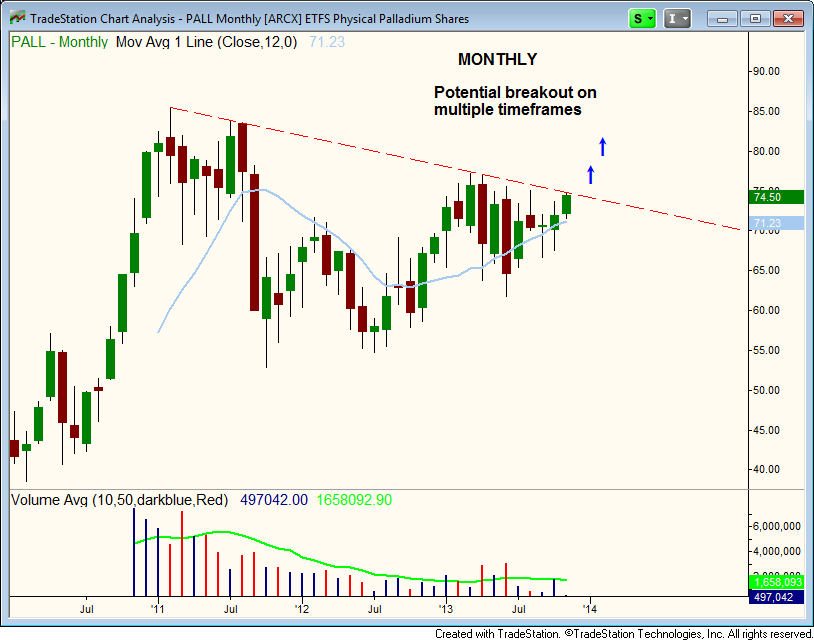
We do have one new buy setup on today’s watchlist in ETFS Physical Palladium Shares ($PALL), which we do not mind taking a long position in since it has a lower correlation to the broad market averages.
$PALL cleared the daily downtrend line yesterday after a few weeks of tightening action above the 20-day and 200-day MAs. After a volatile first few months of base building (lots of wide swings), $PALL has settled down nicely since bottoming out in July.
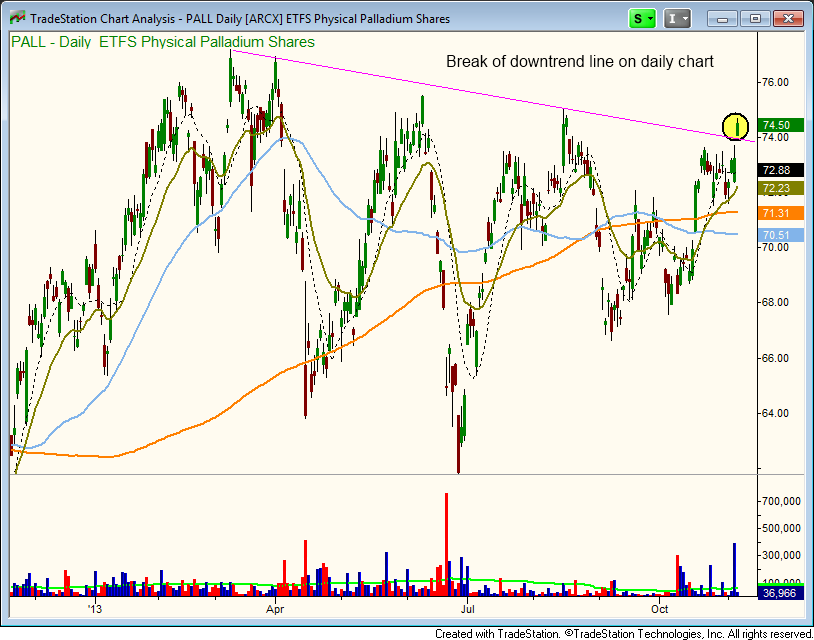
The best trades are typically ones where there is a breakout on multiple time frames. On the monthly chart below, we see $PALL up against three year downtrend line with three touches. The monthly chart also does a better job of showing the tightening of the price action in 2013. We look for $PALL to break the downtrend line and test the prior highs of 2011 at the very least. Trade details can be found in the watchlist section above.
For those struggling with the idea of exiting positions we have just entered, that is simply how it goes when trading. We can never predict when leadership stocks begin to crack, but once we see them break down in numbers we know that it is best to step out of the way in the short-term. We can always re-enter positions if they hold up and we see leading stocks begin to find some traction.