market timing model:
Buy – Signal generated on the close of December 31 (click here for more details)
today’s watchlist (potential trade entries):

Having trouble seeing the open positions graphic above? Click here to view it directly on your web browser instead.
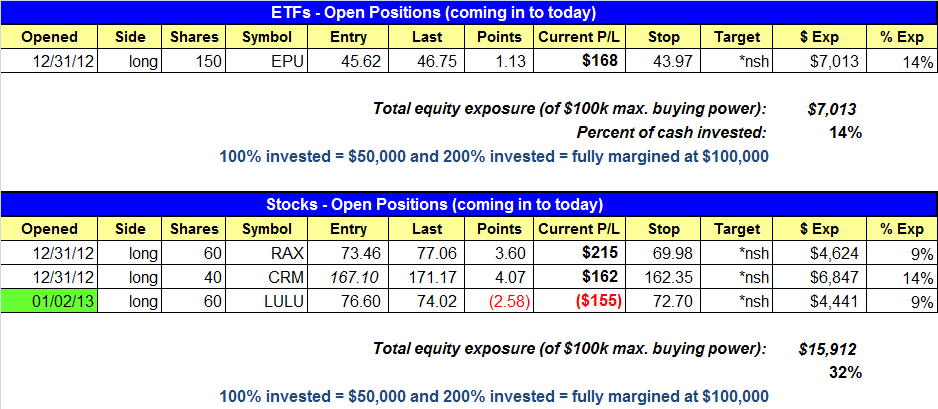
open positions:
Below is an overview of all open positions, as well as a report on all positions that were closed only since the previous day’s newsletter. Net P/L figures are based on two separate $50,000 model portfolios (one for ETFs and one for stocks). Changes to open positions since the previous report are listed in pink shaded cells below. Be sure to read the Wagner Daily subscriber guide for important, automatic rules on trade entries and exits.
Having trouble seeing the open positions graphic above? Click here to view it directly on your web browser instead.
closed positions:

Having trouble seeing the closed positions graphic above? Click here to view it directly on your web browser instead.
ETF position notes:
- Canceled $INP setup. Closed $IBB for a small loss.
stock position notes:
- $LULU buy limit triggered. Canceled $RYL and $REGN buy setups.
Commentary and charts:
Stocks exploded higher on Wednesday, following through on Monday’s impressive action with another big accumulation day. Institutions were in buy mode once again as volume jumped 30% over Monday’s pace on both the NYSE and Nasdaq. Although about 70% of the yesterday’s advance was created by the gap, stocks extended higher intraday and closed at or near the highs of the session.
With the market posting back to back accumulation days, the odds of the market staging a significant rally have increased dramatically in just a few days. The true test will come over the next two to three weeks, as we look for breakouts to hold and extend higher while new setups develop. That constant rotation of new breakouts is what we look for to confirm that a new bull market is under way.
We removed $INP from the watchlist due to the big gap up. Please note the changes made to $XHB. We raised our entry price in hopes of catching a slight pull back in price and also reduced our share size to keep trade risk the same. If $XHB touches the trigger price and your order is not filled, please enter the trade immediately at the market.
Our scans did not turn up many actionable setups and that is to be expected after such a big gap up. We were able to find one ETF that has been consolidating in a tight range the past few months after breaking a weekly downtrend line. Market Vectors-Coal ($KOL) is currently forming a “base at the lows” after a significant decline from the highs of 2011. These lower level bases can be tricky to enter, as we usually see one or more false breakouts along the way before the real breakout occurs.

The daily chart of $KOL shows the 50-day MA in teal starting to trend higher the past few months and the 20-day EMA has now crossed above the 50-day MA and is pointing higher. The 50-day MA is still below the 200-day MA but that is to be expected on a lower level base breakout. We however should always see the price action above the 50-day MA before doing any buying in a base at the lows. The idea isn’t to catch a bottom but to wait for some momentum to build before establishing a position. We also see higher swing lows within the base which is a bullish sign. If the price action pauses for a day or two in the 25.30 to 26.00 area, then we might be able to grab a low risk entry point on a breakout above a two or three day high, which also puts the action above the 200-day MA.

As mentioned above, there wasn’t much in the way of actionable setups on the stock side either, with just about every one of the 20-25 stocks on our internal watchlist gapping well above obvious buy points. $LNKD was one of a few stocks that did not rip higher yesterday, as it undercut the lows of a tight range. If $LNKD can hold above 112.50 for a few days, then we might be able to grab a low risk entry on a pullback off the 20-day EMA. For now there is no clear entry point other than buying the breakout above 117.50. We will keep an eye on this setup for a low risk entry point.

$LULU buy entry triggered on a pullback but failed to hold and sold off to the 20-day EMA. Hopefully the price action can hold the 20-day EMA and push higher within the next few days. $REGN triggered off the watchlist, but we are not counting the trade as an official entry as only 300 shares total went off below 175.00 during the first few seconds of trading. If you are long great! Hold on to your position with the stop we originally posted. We will continue to monitor the setup for a secondary entry point within the next week or two and will continue to post our thoughts on the trade for those who are long. As far as the $RYL setup, we are cancelling the buy limit entry for now but may look for an entry on Friday depending on the action.
If you are a new subscriber, please e-mail [email protected] with any questions regarding our trading strategy, money management, or how to make the most out of this report.
relative strength combo watchlist:
Our Relative Strength Combo Watchlist makes it easy for subscribers to import data into their own scanning software, such as Tradestation, Interactive Brokers, and TC2000. This list is comprised of the strongest stocks (technically and fundamentally) in the market over the past six to 12 months. The scan is updated every Sunday, and this week’s RS Combo Watchlist can be downloaded by logging in to the Members Area of our web site.