- Sell signal generated on close of February 3.
- Neutral signal generated on close of January 24.
- Buy signal generated on close of November 13
- Buy signal generated on close of September 9
- Neutral signal generated on close of August 15
- Buy signal generated on close of July 11
- Neutral signal generated on close of July 5
- Sell signal generated on close of June 24
(click here for more details)
today’s watchlist (potential trade entries):

Having trouble seeing the open positions graphic above? Click here to view it directly on your web browser instead.
open positions:Below is an overview of all open positions, as well as a report on all positions that were closed only since the previous day’s newsletter. Changes to open positions since the previous report are listed in pink shaded cells below. Be sure to read the Wagner Daily subscriber guide for important, automatic rules on trade entries and exits.

Having trouble seeing the open positions graphic above? Click here to view it directly on your web browser instead.
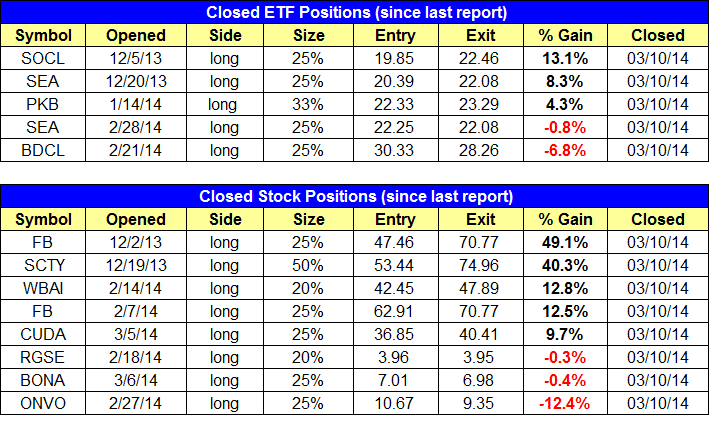
closed positions:
Having trouble seeing the closed positions graphic above? Click here to view it directly on your web browser instead.
ETF position notes:
- Note that the 5-minute rule does not apply to buy orders.
stock position notes:
- Note that the 5-minute rule does not apply to buy orders.
ETF, stock, and broad market commentary:
After selling off during the first 90-minutes of trading, stocks stabilized and bounced higher, closing near the highs of the session. The Nasdaq 100 was the only index to close positive, but the losses in the other averages were mild.
Turnover fell short of Friday’s pace. The light volume makes the reversal action not as convincing. With that said, all major averages are still in trend mode and holding above the 10-day MA (the uptrend is innocent until proven guilty!).
It’s a little late in the current rally to establish new stock or ETF core positions and expect these trades to become monster winners (to be held 3 months or more). True market leaders have already sailed out to sea, so unless one is buying a pullback in a monster leader, most new trades should be of the swing trade variety.
Our weekend and Monday night ETF scans did not produce much in the way of actionable setups. There isn’t much out there on the long side other than potential pullback entries in commodity related ETFs. Which brings us to our first chart in Global X Gold Explorers ETF ($GLDX).
We first established partial size in $GLDX over the high of 3/4 on 3/5. Since the price and volume action was strong on 3/5, we do not mind adding to the position on weakness IF it pulls back in to the 20-day EMA. The 20-day EMA is currently around 15.40, which is also where the short-term uptrend line is.
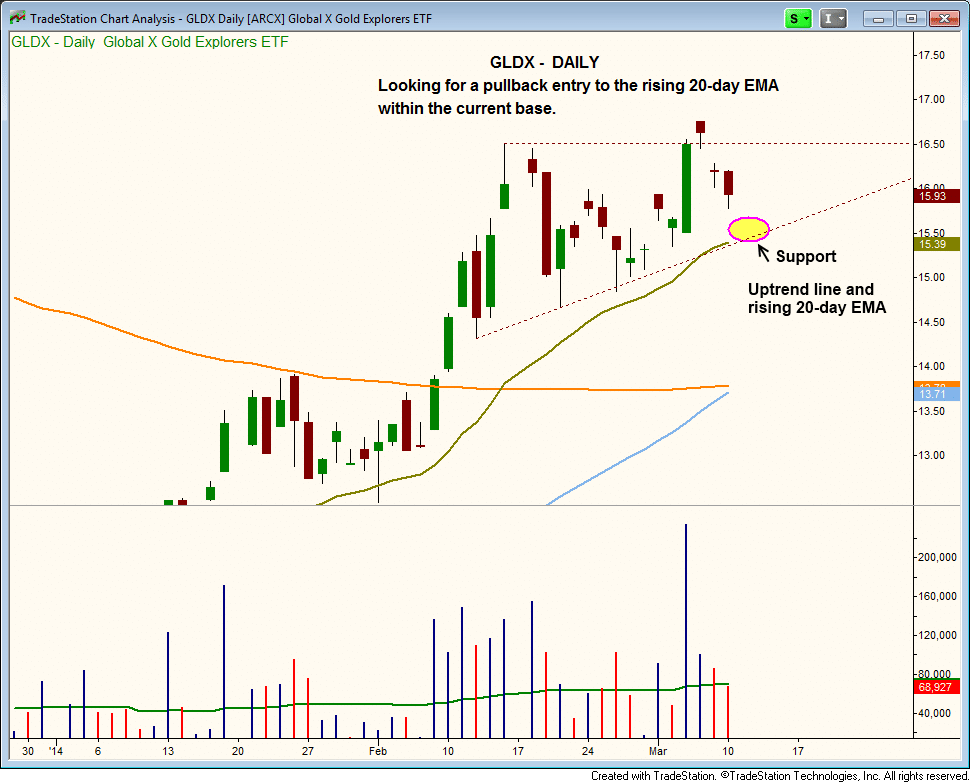 With clear support at 15.40, we are placing $GLDX on Tuesday’s watchlist using a buy limit order. Remember that the 5-minute rule does not apply to buy limit orders.
If $GLDX does not pull in to the 20-day EMA and chops around in a tight range, then we will add to the position on strength.
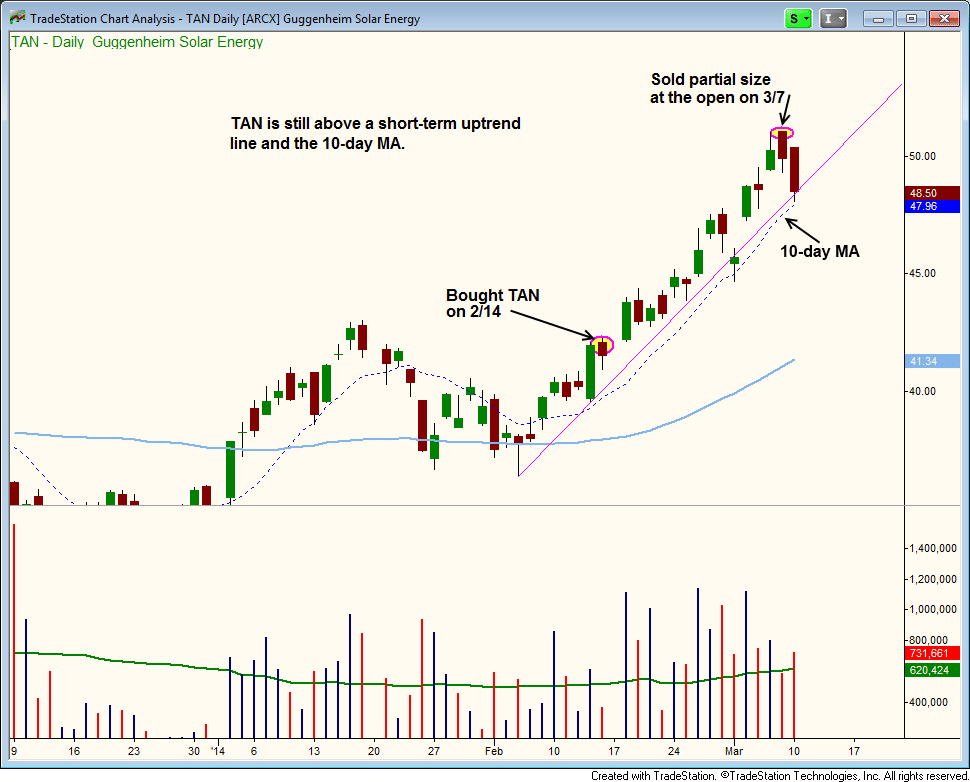
Last Friday, we sold partial size of $TAN on the open to lock in a 21% gain from our entry on 2/14. We are still holding on to the remaining shares, looking for the price action to continue to hold the rising 10-day MA and short-term uptrend line. A break below the 10-day MA could suggest that the price action needs a few weeks of rest.
 On the stock side, we sold two core positions in $FB and $SCTY. We probably sold $FB a bit too soon, and may have been better served by selling half the position and keeping the other half (we never stop learning, as we make mistakes all the time).
By going with a tight stop in $SCTY, we wanted to avoid a pullback to the 50-day MA and possibly giving back another 10-15% or more of our gains. Depending on how $SCTY acts, we may decide to re-enter with partial size down the road.
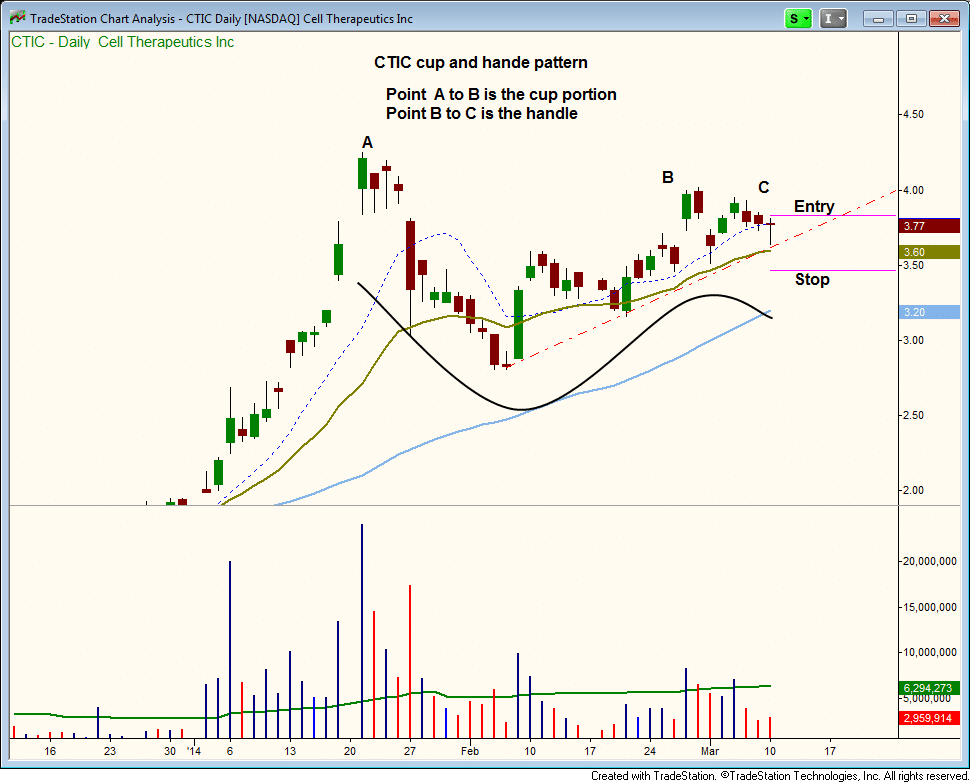
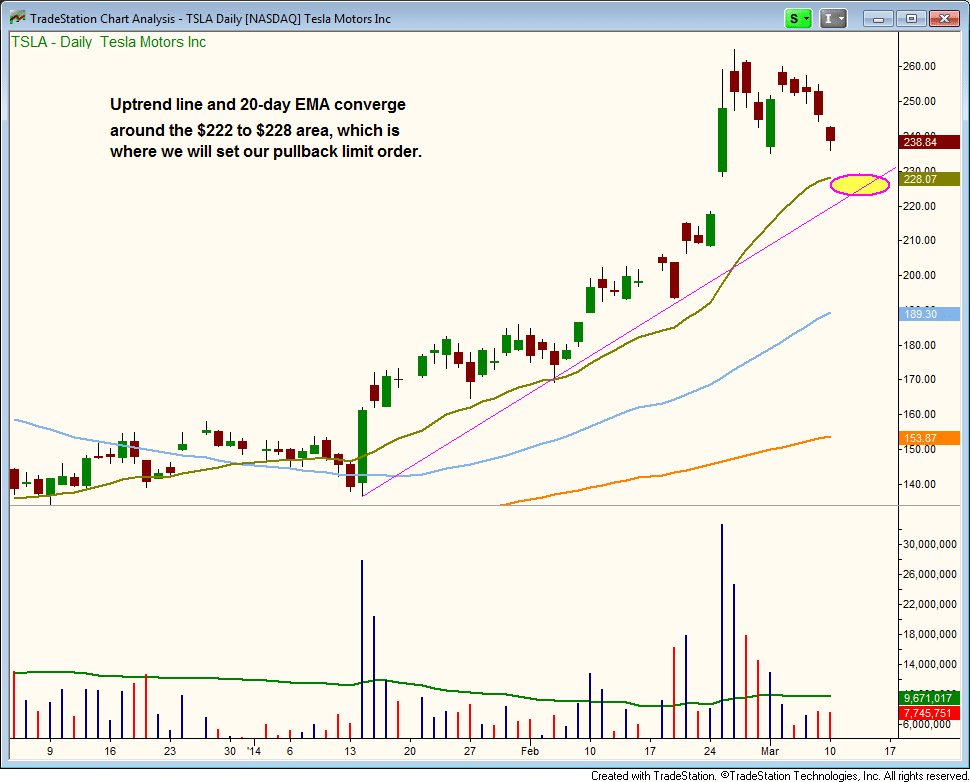
We have two new setups today in $TSLA and $CTIC.
We are placing a buy limit order in $TSLA around $227 (adding to current position), which looks to be a logical support area from the rising 20-day EMA and uptrend line. $TSLA is the best stock in the market and has the ability to run higher even if market conditions deteriorate.
 $CTIC is a swing trade in a small but liquid biotech stock that has formed a 7-week cup and handle pattern. With biotechs taking a beating the past two weeks, this sector may be due for some sort of bounce. If so, we could see a decent pop in $CTIC.