market timing model:
Sell – Signal generated on the close of October 12 (click here for more details)
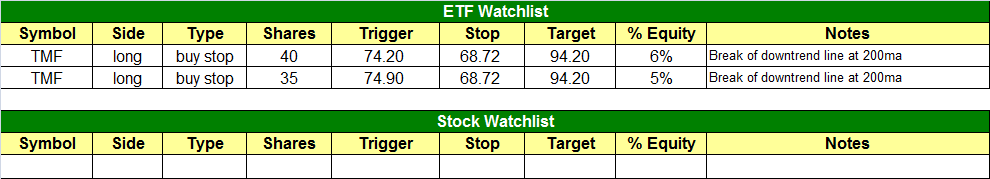
today’s watchlist (potential trade entries):
Having trouble seeing the open positions graphic above? Click here to view it directly on your web browser instead.
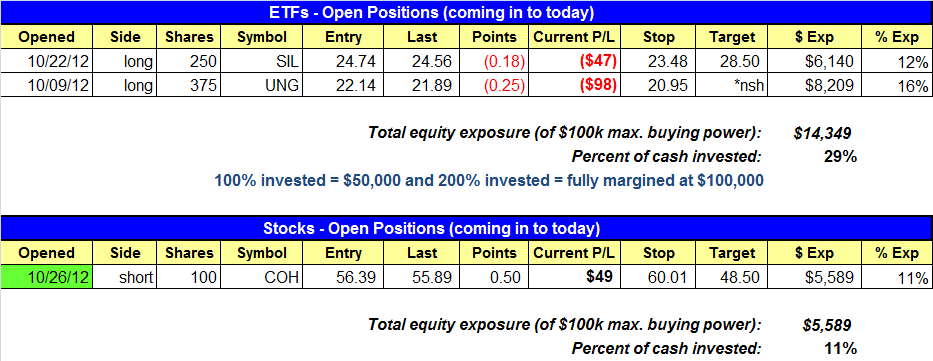
open positions:
Below is an overview of all open positions, as well as a report on all positions that were closed only since the previous day’s newsletter. Net P/L figures are based on two separate $50,000 model portfolios (one for ETFs and one for stocks). Changes to open positions since the previous report are listed in pink shaded cells below. Be sure to read the Wagner Daily subscriber guide for important, automatic rules on trade entries and exits.
Having trouble seeing the open positions graphic above? Click here to view it directly on your web browser instead.
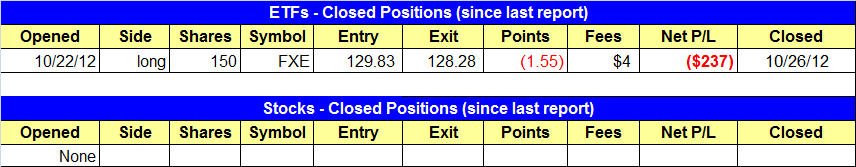
closed positions:
Having trouble seeing the closed positions graphic above? Click here to view it directly on your web browser instead.
ETF position notes:
- Note the split entry in the TMF setup.
- FXE stop hit and we are out with a smaller than average loss.
stock position notes:
- COH short entry triggered.
ETF and broad market commentary:
Stocks concluded a bearish week in uneventful fashion, as the major indices opened near the flatline, drifted lower to “undercut” their recent lows in the morning, then recovered in the afternoon to close with mixed results. The Nasdaq Composite ($COMPX) eked out a gain of 0.1%, the Dow Jones Industrial Average ($DJIA) was unchanged, and the S&P 500 Index ($SPX) edged 0.1% lower. Small and mid-caps showed a bit of relative weakness, as the Russell 2000 Index ($RUT) lost 0.4% and the S&P Midcap 400 Index ($MID) declined 0.3%. All the main stock market indexes closed just above the middle of their intraday trading ranges, but near their lows of the week.
Turnover across the board was slightly lower, but volume remained above 50-day average levels. Total volume in the NYSE eased 5%, while volume in the Nasdaq was 4% lighter than the previous day’s level. In the NYSE, declining volume exceeded advancing volume by a margin of just over 2 to 1. The Nasdaq ADV/DEC volume ratio was only fractionally negative. Combined with the indecisive intraday price action of the broad market, the lighter volume levels pointed to an overall apathetic session last Friday.
The Direxion 30-year Treasury Bull 3X ETF ($TMF), an index that tracks the performance of long-term government T-bonds, has been in a long-term uptrend since February of 2011, but has been in an intermediate-term correction off its highs since July of 2012. Now, it appears as though TMF is setting up to break out above resistance of its 3-month downtrend line and resume the long-term uptrend that has been in place for nearly 2 years. The weekly chart below shows the long-term uptrend in TMF, while the daily chart that follows shows the potential breakout above the intermediate-term downtrend line.


In technical analysis, a longer-term trendline holds more weight and bearing over future price direction than a shorter-term trendline. Therefore, if TMF manages to breakout above its 50-day MA, it will have broken out above the downtrend line shown on the second chart, which should enable it to resume its dominant uptrend shown on the first chart. TMF has been added to the “ETF Trading Watchlist” of today’s Wagner Daily newsletter as an “official” trade setup, so subscribers to our swing trading newsletter should note our exact entry, stop, and target prices for this ETF trade setup. FYI, iShares 20+ year Treasury Bond ETF ($TLT) is the regular, non-leveraged version of TMF (which ties up a lot more buying power in one’s account). Normally, we are cautious about entering leveraged ETFs because they frequently underperform the underlying index, but we’ve observed that TMF has been tracking very closely to the price of TLT.
Over the weekend, we spent several hours scanning the chart patterns of hundreds of ETFs, looking for any ideal hidden opportunities for the coming week. But we were generally not impressed with what we saw. We’re listing TMF as a potential “trend reversal” setup only because it is a fixed-income ETF, which has a low direct correlation to the direction of the overall stock market. Otherwise, we remain focused on selling short (or buying inversely correlated “short ETFs”). On the short side, we continue to monitor an internal watchlist with potential short selling candidates. Tickers include PowerShares QQQ Trust ($QQQ) and iShares Nasdaq Biotech ($IBB), both of which we are waiting for a substantial bounce before short entry (or inverse ETF buy entry).
On the long side, select emerging markets ETFs are still looking pretty good and are holding near their recent highs ($EWH, $GREK, $EPHE, and a few others). However, since our market timing model has been on a “sell” signal since October 12, we are presently not interested in buying stock-based international ETFs because they will eventually succumb to weakness if US stocks continue lower from here. Nevertheless, when the broad market eventually bounces, very short-term active traders may independently look to these ETFs as potential quick, momentum-based trades (just beware they are countertrend to the broad market, which we do not advocate for our swing trading system).
stock commentary:
Friday’s reversal action may lead to a short-term bounce in the major averages. Our $COH short entry triggered on Friday but did show relative weakness vs the S&P 500 into the close. Although it is not ideal to enter mutliple short positions at current levels, having one short on isn’t a bad idea even with the market potentially reversing because overall conditions remain very weak.
$CMI is a potential short setup we are monitoring for an ideal entry point. Earnings are due before the bell on October 30, which could provide us with the shakeout bar we are looking for on the daily chart below.

The weekly chart shows the monster run up since 2009. After a false breakout to new highs in January, $CMI which was once a market leader is now a laggard in 2012. If we do short CMI we would only be looking for a move to test support around the 82.00 – 83.00 area.

If you are a new subscriber, please e-mail [email protected] with any questions regarding our trading strategy, money management, or how to make the most out of this report.
relative strength combo watchlist:
Our Relative Strength Combo Watchlist makes it easy for subscribers to import data into their own scanning software, such as Tradestation, Interactive Brokers, and TC2000. This list is comprised of the strongest stocks (technically and fundamentally) in the market over the past six to 12 months. The scan is updated every Sunday, and this week’s RS Combo Watchlist can be downloaded by logging in to the Members Area of our web site.