market timing model:
BUY (click here for more details)
today’s watchlist (potential trade entries):

open positions:
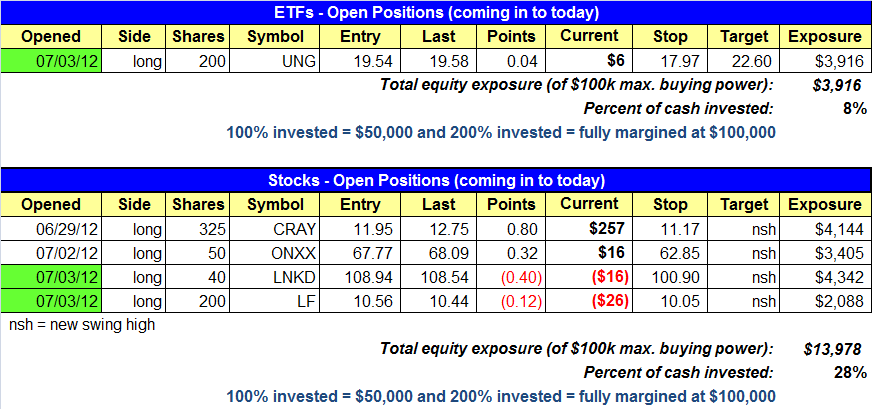
Below is an overview of all open positions, as well as a report on all positions that were closed only since the previous day’s newsletter. Net P/L figures are based on two separate $50,000 model portfolios (one for ETFs and one for stocks). Changes to open positions since the previous report are listed in red shaded cells below. Be sure to read the Wagner Daily subscriber guide for important, automatic rules on trade entries and exits.

Having trouble seeing the open positions graphic above? Click here to view it directly on your web browser instead.
closed positions:

Having trouble seeing the closed positions graphic above? Click here to view it directly on your web browser instead.
ETF position notes:
- No trades were made.
stock position notes:
- The first buy entry for LF triggered.
- LNKD buy setup triggered.
ETF and broad market commentary:
In a Holiday shortened session, stocks closed higher yesterday. All five major indices closed near session highs. The light volume rally was led by a 1.3% on the small-cap Russell 2000 and a 1.2% gain on the S&P MidCap 400. The Nasdaq tacked on a solid 0.8%, while both the DJIA and S&P 500 advanced by 0.6%.
Internals were mixed across the board on Tuesday. As would be expected entering the July 4th Holiday, volume dropped on the Nasdaq by almost 15.0% and on the NYSE by 37.0%. However, advancing volume topped declining volume by a factor of about 2.0 to 1 on both exchanges. With respect to market internals, little useful information can be derived from shortened sessions.
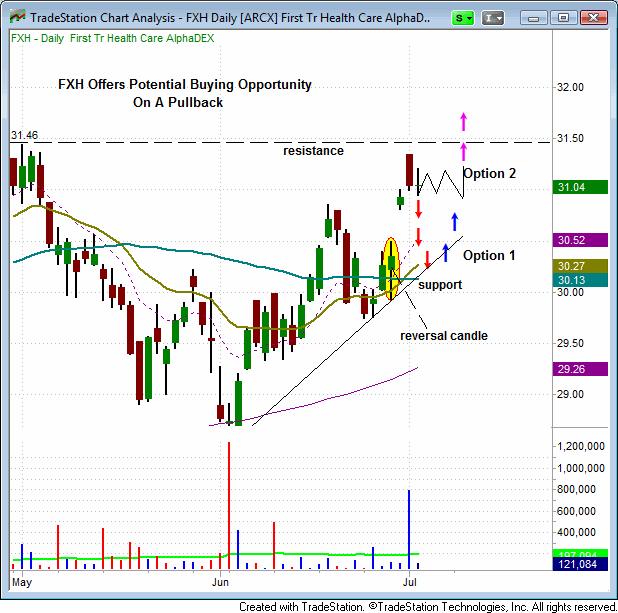
Over the past five sessions, First Trust Health Care AlphaDEX ETF (FXH) has rallied into resistance near its previous swing high of $31.45. Over the past two sessions, FXH has show signs of pulling back from this key mark. FXH offers a buying opportunity under two scenarios. The first would be a pullback buy entry into support of the 20-day EMA and the uptrend line. An alternative entry could develop if FXH consolidates just below resistance over the next 5 to 10 days. Under either circumstance, we would only enter a long position in this ETF if it provide an appropriate “setup”. Typically we will look to enter above a reversal candle, much like the one formed on June 18th. Given the relative strength exhibited by this ETF (It’s near a 52-week high), we will continue to monitor it closely for a possible buy entry.

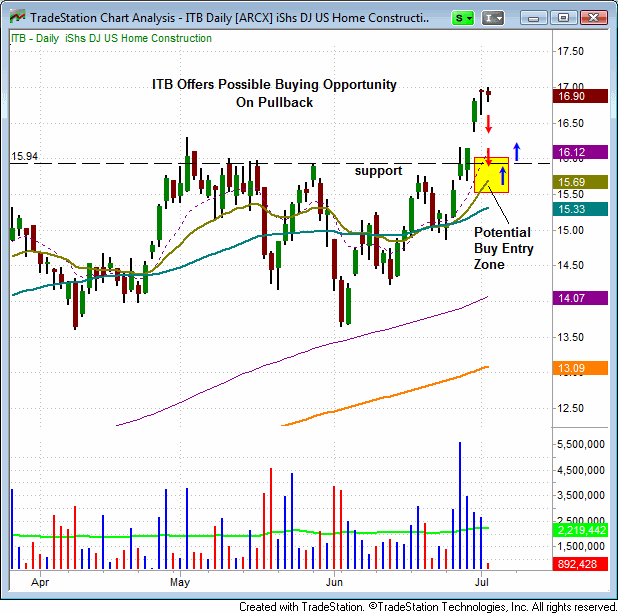
During the market’s recent move higher, the homebuilder sector has shown significant strength, as it has led the advance by ralling to fresh 52-week highs. By extension, the iShares Dow Jones U.S. Home Construction ETF (ITB) now offers a potential buying opportunity on a pullback to support of its 10-day and 20-day moving averages. As with FXH, we will only look to enter a position in ITB if it presents a setup that meets are trading criteria.

UNG hit its trigger on Tuesday and performed well throughout the session. With our timing model showing a buy signal we will now be carefully monitoring how the market reacts during pullbacks. Given the sharp reversal in the market, we wouldn’t be surprised to see a retracement in the market over the next day or two, but we would also expect for it to occur on lighter volume. Light volume retracements are what tell us that Bulls remain in control of the market.
stock commentary:
SYNC has been consolidating near the highs the past six weeks while holding above the 20-day EMA. There are no signs of heavy volume selling in the base, which is a bullish sign. We’d like to see the price action pull back to the 20-day EMA before breaking out. If the stock does breakout before offering us a low risk entry point we will continue to monitor the action for a pullback entry.

There are no new official setups for today. With the LNKD and LF entries on Tuesday, we now have four open long positions adding up to 30% long expsoure. We are comfortable with as much as 50% to 60% exposure if the market continues to act well and avoids distribution. Our confidence in the market will depend on just how well our open positions perform.
If you are a new subscriber, please e-mail [email protected] with any questions regarding our trading strategy, money management, or how to make the most out of this report.
relative strength watchlist:
Our Relative Strength (or RS) Watchlist makes it easy for subscribers to import data into their own scanning software, such as Tradestation, Interactive Brokers, and TC2000. This list is comprised of the strongest 100 (or so) stocks in the market over the past six to 12 months. The scan is updated every Sunday, and this week’s RS Watchlist can be downloaded by logging in to the Members Area of our web site.