market timing model: (Confirmed) Buy
Current signal generated on close of September 9.We are now in confirmed buy mode, so portfolio exposure can be more than 100% if you have a marginable account. However, please make sure that current long positions in your portfolio are working before adding new ones. Portfolio exposure should be at least 75% to 100% (or more) right now.
Past signals:
- Neutral signal generated on close of August 15
- Buy signal generated on close of July 11
- Neutral signal generated on close of July 5
- Sell signal generated on close of June 24
today’s watchlist (potential trade entries):

Having trouble seeing the open positions graphic above? Click here to view it directly on your web browser instead.
open positions:
Below is an overview of all open positions, as well as a report on all positions that were closed only since the previous day’s newsletter. Changes to open positions since the previous report are listed in pink shaded cells below. Be sure to read the Wagner Daily subscriber guide for important, automatic rules on trade entries and exits. Click here to learn the best way to calculate your share size.

Having trouble seeing the open positions graphic above? Click here to view it directly on your web browser instead.
closed positions:
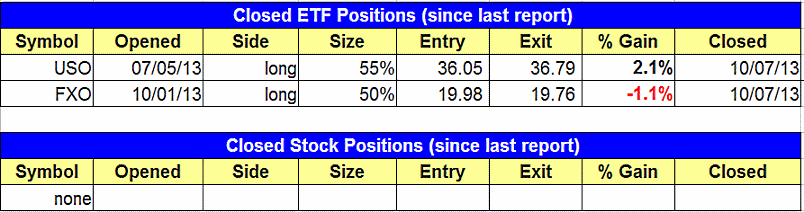
Having trouble seeing the closed positions graphic above? Click here to view it directly on your web browser instead.
ETF position notes:
- Sold $FXO and $USO at the market on the open. Canceled the $XLV setup for now.
stock position notes:
- $LNKD pullback entry triggered. Note the new stops above.
ETF, stock, and broad market commentary:
Stocks sold off in the morning session and once again into the close, resulting in heavy losses across the board in the major averages (about 1.0% lower). However, volume was lighter on both exchanges, so it was technically not a distribution day. While some leading stocks may have sold off by 4% or more, we did not see heavy volume damage to the charts, which is our main concern when the market is in pullback mode.
A break of the 20-day EMA in the NASDAQ Composite should lead to a test of the $3,700 level, where there is support from the highs of the last base and the rising 10-week MA (or 50-day MA).

PowerShares Aerospace & Defense (ETF) has pulled back in with the broad market averages, and is attempting to hold support from the rising 50-day MA and the prior low risk entry point just below $27. We often see stocks or ETFs reverse at prior buy points after a sharp selloff, as many traders will set break-even stops once a trade is slightly in their favor.
A move above the two-day high and the short-term downtrend line could spark some buying interest.

After failing to hold support at the 20-day EMA, iShares MSCI Japan Index ($EWJ) has pulled back to a key support level, where the downtrend line and 10-week MA converge at $11.50. $EWJ should hold above this downtrend line if it is going higher over the next few weeks, as a breakdown below the 10-week MA could result in a move to the 40-week MA, around $11.

On the stock side, $YELP has held above the 10-week MA for more than a month, so a break of the 10-day MA would force us to raise the stop on partial size to protect gains. Depending on how the market and leadership stocks are acting, we may decide to close out half the position or more if the break is on heavy volume. We have a plan in place.

Due to our early entry points, we are in pretty good shape to hold at least partial size in $SLCA through a market correction. We should be in good shape as long as the price action holds above the 10-week MA.
