Commentary:
Following through from Tuesday’s distribution, stocks struggled at the open on Wednesday. But, at 10:00 am the markets reversed and trading ended up on the day. The action was subdued, as volume was modest throughout the day. All of the major indices closed in positive territory. The small-cap Russell 2000 and S&P MidCap 400 led the advance by posting 1.2% and 0.9% gains respectively. The Nasdaq advanced 0.6%, while the S&P 500 managed a 0.4% gain on the session. The Dow Jones Industrial Average was the laggard on Wednesday, as it struggled to close in positive territory. Still, it did manage a 0.1% improvement on Wednesday.
Turnover was down for the session. Volume fell by 9% on the Nasdaq and 1.9% on the NYSE. Advancing volume outpaced declining volume on the Nasdaq by a ratio of 1.4 to 1. On the NYSE, the ratio finished slightly better at 2.2 to 1.
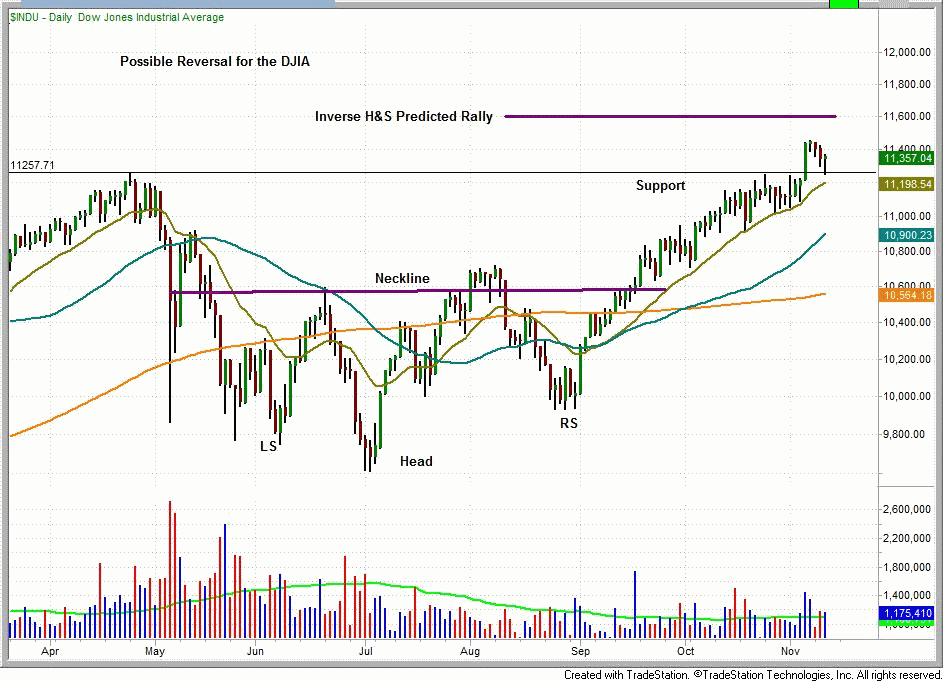
In light of Tuesday’s selling pressure, it is useful to evaluate the broad market to gain a better picture of support and resistance levels. Below are two charts of the Dow Jones industrial average. On the daily chart you will notice that we recently rallied above the April 26th swing high of 11,258. During today’s session the market briefly tested, and then bounced off of the former swing high set in April. This now represents support. The predicted rally of the inverse head and shoulders (measured from bottom of head to neckline), establishes a potential area of resistance at 11,600. These technical indicators suggest that the market may be due for a correction.
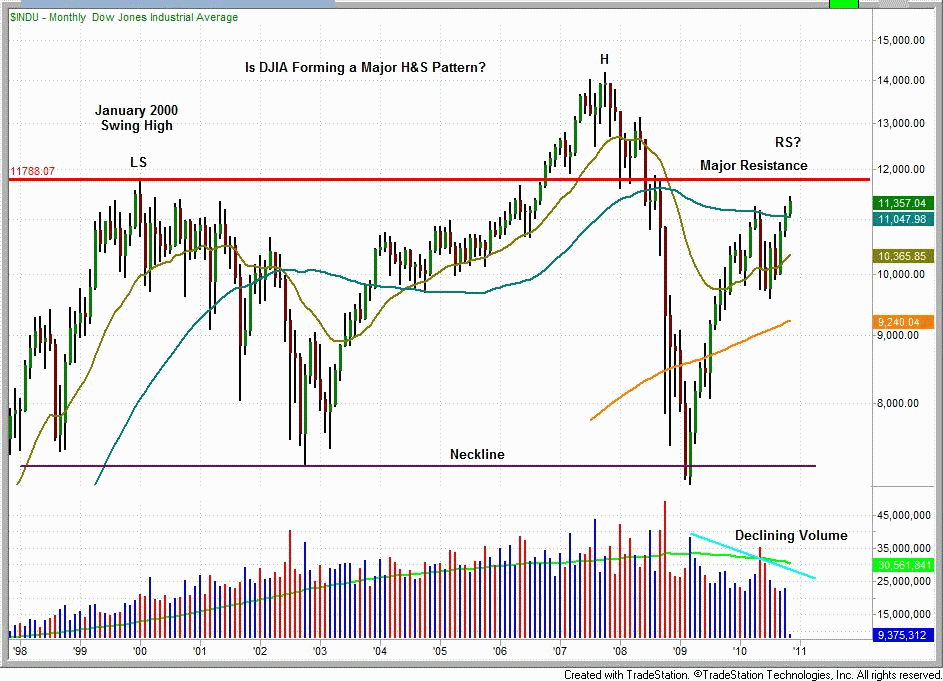
The 15-year monthly chart of the Dow Jones Industrial Average provides another perspective of potential market resistance. Notice, that just above the 11,600 resistance level on the daily chart, looms another zone of resistance at 11,800. Not only does this level coincide with the January 2000 swing high, but it may also represent the start of the right shoulder in a decade long Head and Shoulders formation. It is also noteworthy that volume has been declining since the rally began in March 2009. Until the pattern forms, it is not possible to know if we are in the midst of a major head and shoulders pattern. However, we do know that the January 2000 high of 11,800 will likely provide significant resistance for the DJIA.
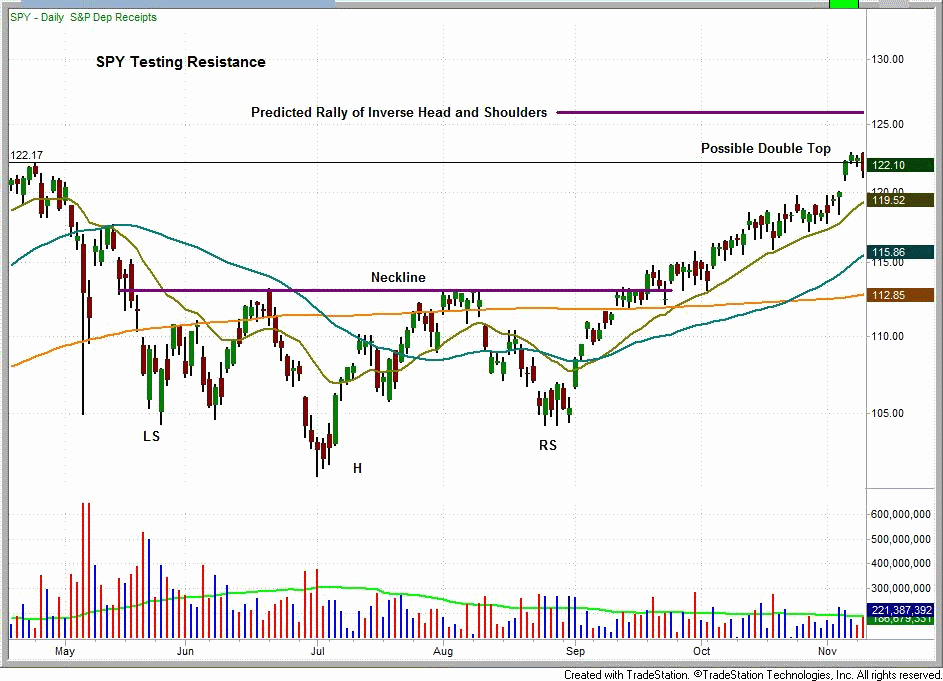
The SPDR S&P 500 ETF (SPY), may also be close to reversing the current uptrend. The technical pattern is eerily similar to that of the DJIA. It is possible that we are in the midst of forming a double top formation. The SPY briefly rallied above the April high, sold off and is now trading just below that high. Further, the predicted rally of the inverse head and sholders pattern for SPY is approximately $126.00. This is just above the double top that is possibly forming.
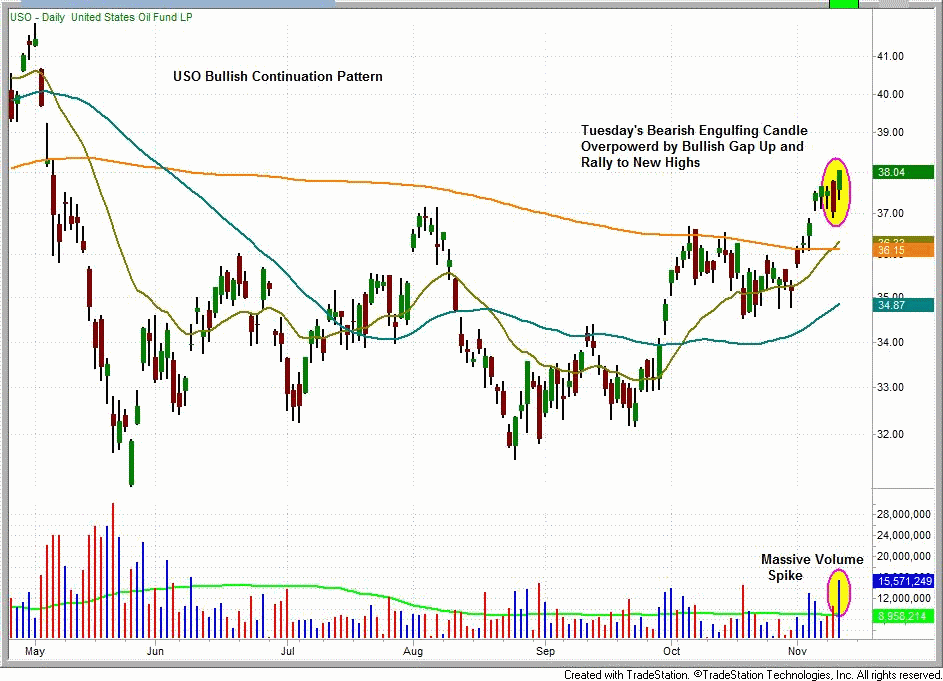
Our position in USO remains strong. Despite Tuesday’s bearish engulfing candle, USO gapped up on Wednesday and rallied on big volume into the close. Wednesday’s strong reversal will likely create a short squeeze and further fuel the rally.
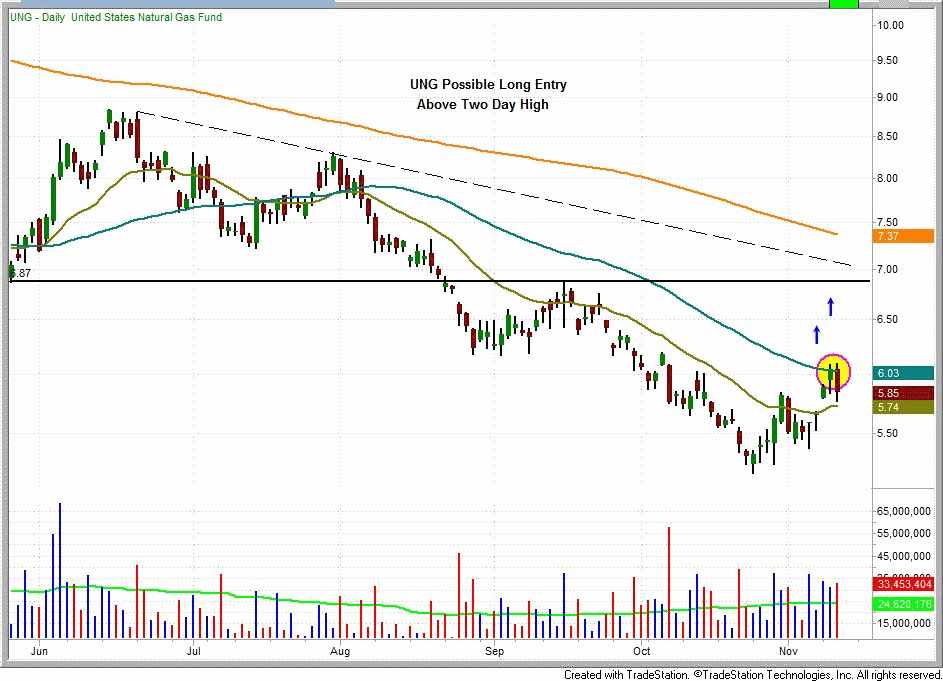
After a bullish gap day on November 8th, the United States Natural Gas ETF, LP (UNG), rallied into the 50-day MA on Tuesday. Yesterday UNG attempted to break Tuesday’s highs, but was met with selling pressure. UNG is now trading between the 20 and 50-day Moving Averages. A break above the two-day high would provide a logical entry point for UNG. We are monitoring this ETF closely.
The market is likely at a crossroad. There is convergence of technical indicators across various timeframes that suggest a reversal is forthcoming. We are inclined to trade with extra caution and look to enter positions that are not heavily correlated to the market.
Today’s Watchlist:
There are no new official setups this morning. We will send an Intraday Alert if anything catches our eye while trading.
Daily Performance Report:
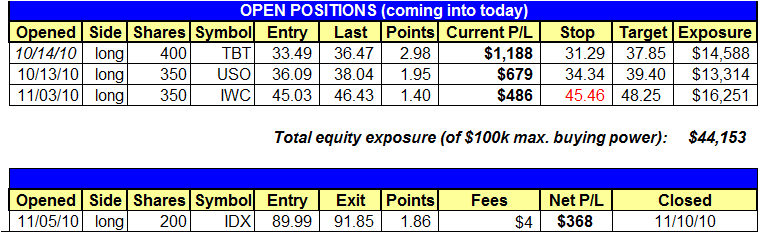
Below is an overview of all open positions, as well as a performance report on all positions that were closed only since the previous day’s newsletter. Net P/L figures are based on the $50,000 Wagner Daily model account size. Changes to open positions since the previous report are listed in red text below. Please review the Wagner Daily Subscriber Guide for important, automatic rules on trigger and stop prices
On Wednesday, IDX hit our stop and we exited the trade. We remain in IWC as it did not hit our new stop $45.46 (below yesterday’s low and just above breakeven).
- Reminder to subscribers – Intraday Trade Alerts to your e-mail and/or mobile phone are normally only sent to indicate a CHANGE to the pre-market plan that is detailed in each morning’s Wagner Daily. We sometimes send a courtesy alert just to confirm action that was already detailed in the pre-market newsletter, but this is not always the case. If no alert is received to the contrary, one should always assume we’re honoring all stops and trigger prices listed in each morning’s Wagner Daily. But whenever CHANGES to the pre-market stops or trigger prices are necessary, alerts are sent on an AS-NEEDED basis. Just a reminder of the purpose of Intraday Trade Alerts.
- For those of you whose ISPs occasionally deliver your e-mail with a delay, make sure you’re signed up to receive our free text message alerts sent to your mobile phone. This provides a great way to have redundancy on all Intraday Trade Alerts. Send your request to [email protected] if not already set up for this value-added feature we provide to subscribers.
Having trouble seeing the position summary graphic above?
Click here to view it directly on your Internet browser instead.
Notes:
Edited by Deron Wagner,
MTG Founder and
Head Trader