Buy
– Signal generated on the close of April 30 (click here for more details)
today’s watchlist (potential trade entries):

Having trouble seeing the open positions graphic above? Click here to view it directly on your web browser instead.
open positions:
Below is an overview of all open positions, as well as a report on all positions that were closed only since the previous day’s newsletter. Net P/L figures are based a $100,000 model portfolio. Changes to open positions since the previous report are listed in pink shaded cells below. Be sure to read the Wagner Daily subscriber guide for important, automatic rules on trade entries and exits.

Having trouble seeing the open positions graphic above? Click here to view it directly on your web browser instead.
closed positions:

Having trouble seeing the closed positions graphic above? Click here to view it directly on your web browser instead.
ETF position notes:
- No setups triggered. Note the changes to the share size and trigger price in the $DZZ buy setup.
stock position notes:
- $PRKR buy setups triggered. Note the new stop in $CLDX.
ETF, stock, and broad market commentary:
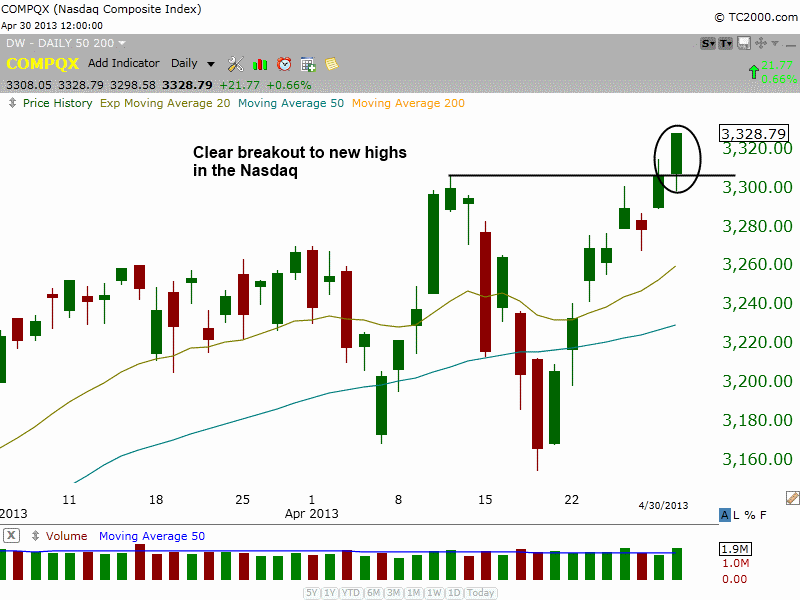
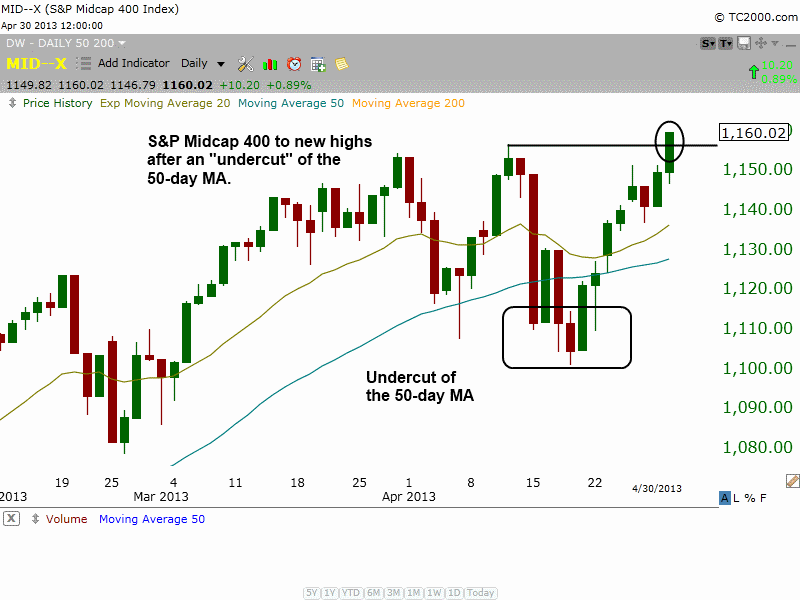
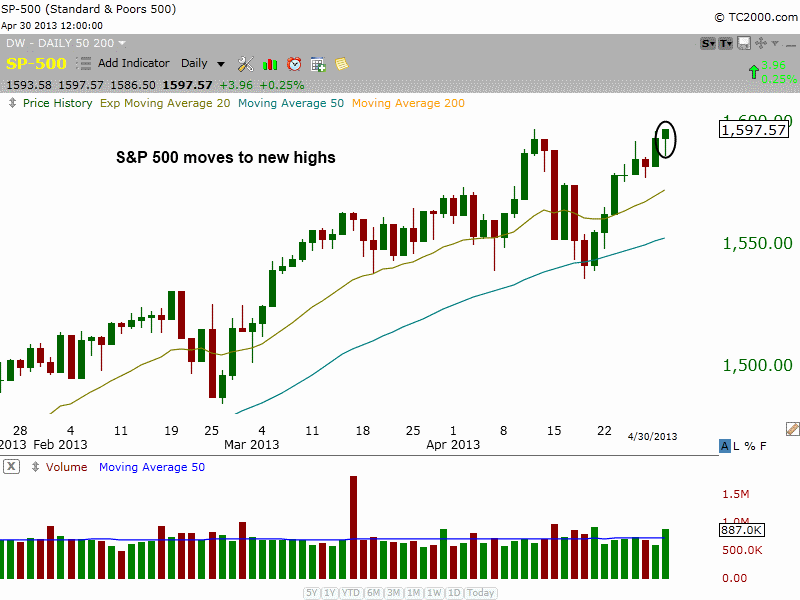
Building on the momentum from Monday’s breakout to new highs, the Nasdaq Composite rallied 0.7% on heavy volume. The S&P 500 and S&P Midcap 400 joined the Nasdaq by setting new highs as well. Turnover was also higher on the NYSE, confirming the breakout in the S&P 500.
After a two day shakeout below the 50-day moving average, the Nasdaq Composite has ripped to new highs with gains in 7 of the past 8 sessions. Clearly, buying the dip is still in vogue, with every significant pullback to the 50-day MA quickly leading to new highs in the Nasdaq this year.
The S&P 400 Midcap Index led the market higher yesterday, with a 0.9% gain to new highs. Much like the Nasdaq, there was a quick dip or shakeout below the 50-day MA, followed by a sharp reversal new highs highs.
The S&P 500 hit a new closing high:
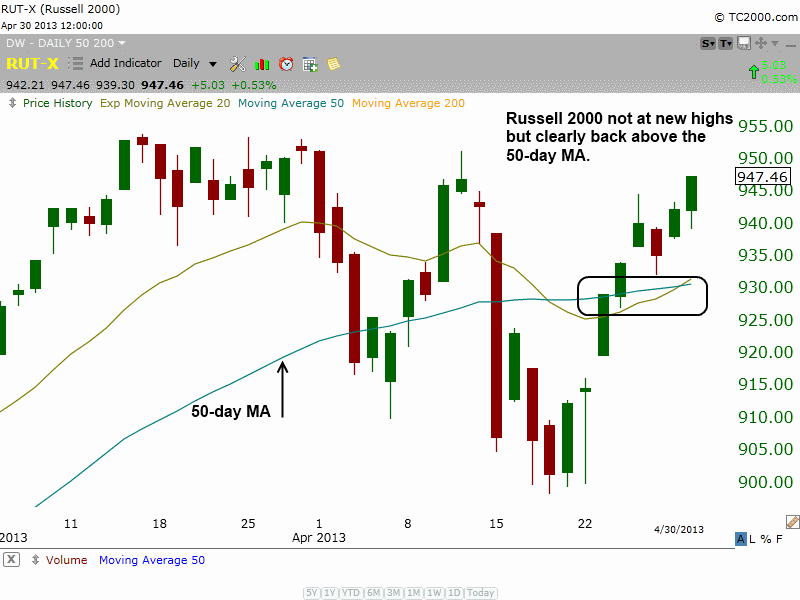
Although the small-cap Russell 2000 has yet to move to new highs, it has made an impressive recovery after a nasty shakeout below the 50-day MA. With the price action well above the 50-day MA and the 20-day EMA now crossing back above the 50-day MA, this index could easily move to new highs by the end of the week.
With all the major averages now trading above the 50-day MA, and the S&P 500, 400, and Nasdaq setting new highs, we are comfortable shifting the timing model to buy mode. Once we realized that leadership stocks were holding up, we moved the timing model out of sell mode and in to neutral, while adding new long positions ahead of the market breaking out. Over the past few weeks, we have stated several times that paying attention to leading stocks and groups is best way to gauge the health of the market. So far, leading stocks are either breaking out or forming constructive patterns.
$LNKD pushed to new highs on higher volume after a three day pause. $LNKD is scheduled to report earnings after the close on May 2, so if you are uncomfortable holding through earnings you should exit the position into strength ahead of the report. Because we have a decent profit buffer we do not mind holding $LNKD through earnings.
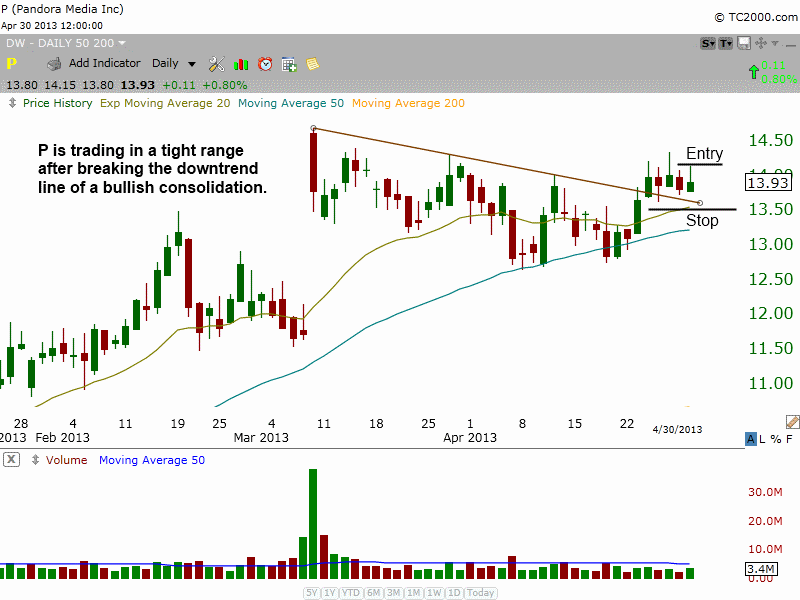
$P is on today’s watchlist as a potential breakout play above Tuesday’s high. $P is an IPO from 2011 that has recently broken a weekly downtrend line. This if the first constructive base on the weekly chart since emerging off the lows.
We love the bullish, 8-week consolidation above the 50-day MA, along with the tight price action the past few days. We are going with a pretty tight stop for two reasons: 1) The swing low is too far away to place the stop and 2) $P reports earnings on May 15, so we really want the setup to take off ahead of earnings. If our entry is right and $P takes off, it has the potential to rip 30-40% over the next 4-8 weeks.
relative strength combo watchlist:
Our Relative Strength Combo Watchlist makes it easy for subscribers to import data into their own scanning software, such as Tradestation, Interactive Brokers, and TC2000. This list is comprised of the strongest stocks (technically and fundamentally) in the market over the past six to 12 months. The scan is updated every Sunday, and this week’s RS Combo Watchlist can be downloaded by logging in to the Members Area of our web site.