Buy
– Signal generated on the close of April 30
Due to the recent distribution in the Nasdaq, we are no longer in confirmed buy mode (now is not the time to step on the gas). We remain in buy mode, but if market conditions continue to deteriorate the timing model will shift to sell mode.
today’s watchlist (potential trade entries):

Having trouble seeing the open positions graphic above? Click here to view it directly on your web browser instead.
open positions:
Below is an overview of all open positions, as well as a report on all positions that were closed only since the previous day’s newsletter. Net P/L figures are based a $100,000 model portfolio. Changes to open positions since the previous report are listed in pink shaded cells below. Be sure to read the Wagner Daily subscriber guide for important, automatic rules on trade entries and exits.

Having trouble seeing the open positions graphic above? Click here to view it directly on your web browser instead.
closed positions:

Having trouble seeing the closed positions graphic above? Click here to view it directly on your web browser instead.
ETF position notes:
- $UNG sell stop triggered and we are out.
stock position notes:
- No trades were made.
ETF, stock, and broad market commentary:
After a tough two and a half day sell off, stocks staged an impressive recovery Thursday afternoon, with all major averages closing more than 1.0% off the lows of the day and in positive territory. Turnover failed to confirm the move, as volume was lighter across the board. Although the light volume was a bit of a disappointment, we are more concerned with the averages finding some traction in the short term (volume can always come in one or two weeks after a bottom is in place).
We are not ready to call a bottom in the market but Thursday’s action was a good start. Our timing model remains in buy mode, but there are very few (if any) actionable setups in A rated stocks or top relative strength ETFs that are ready to break out within the next few days. Patience is key as we wait for new buy setups to develop.
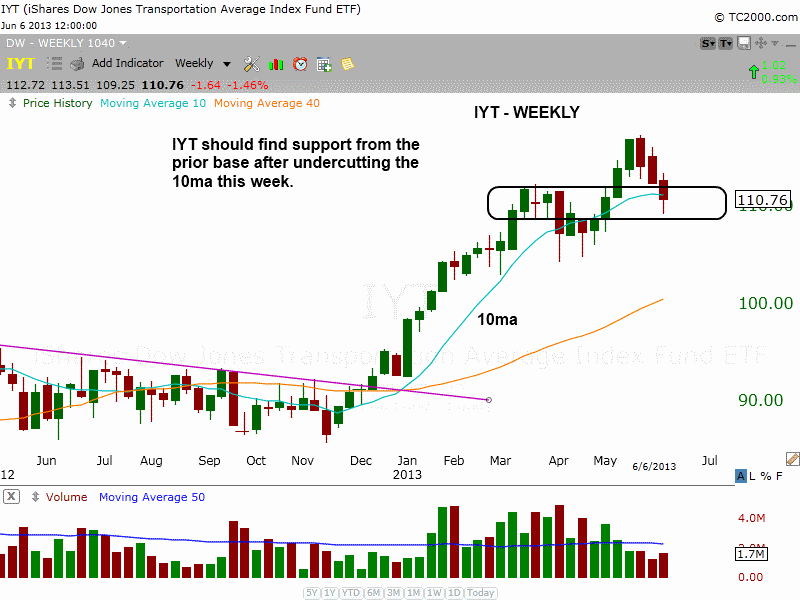
When the market is in pullback mode within a strong uptrend, prior bases in stocks and ETFs should serve as a logical support area. The recent pullback in $IYT is a good example of a prior base that should provide support. The recent breakout in $IYT stalled in mid-May, so the current pullback should find support from the upper half of the last base and the rising 50-day MA.

$IYT is not actionable for us at current levels, but if the price action can consolidate for 2-3 more weeks above the 50-day MA, then a low risk buy point could emerge.
On the weekly chart below, note the big pick up in volume over several weeks as the Market Vectors Vietnam ETF ($VNM) rallied from last December to February. After a two month long correction to the 40-week MA, the price action stabilized and rallied back above the 10-week MA.

Dropping down to the daily chart, we see that $VNM has broken the downtrend line of the consolidation and is now back above the 50-day MA. Since reclaiming the 50-day MA, the price action has set a few higher swing lows. $VNM could potentially undercut the last swing low and touch the 50-day MA, but as long as support holds at the 50-day MA the setup is still intact.

The ideal buy entry in $VNM is on a breakout above the current swing high at $21.50. Depending on the price action over the next week or two, an earlier entry point could develop. On an early entry we usually take partial size and look to add the rest on a breakout above the swing high.
$UNG long stopped us out yesterday, as the price action undercut the 200-day MA. $UNG will remain on our radar, especially if the action recovers back above the 200-day MA next week.
$AMBA and $KORS continue to hold up. Since $AMBA failed to breakout on earnings, we will probably see a few weeks of basing action before there is another breakout attempt. As for $KORS, the price action is holding the 20-day EMA for now, but we could still see a shakeout below the four day low next week.
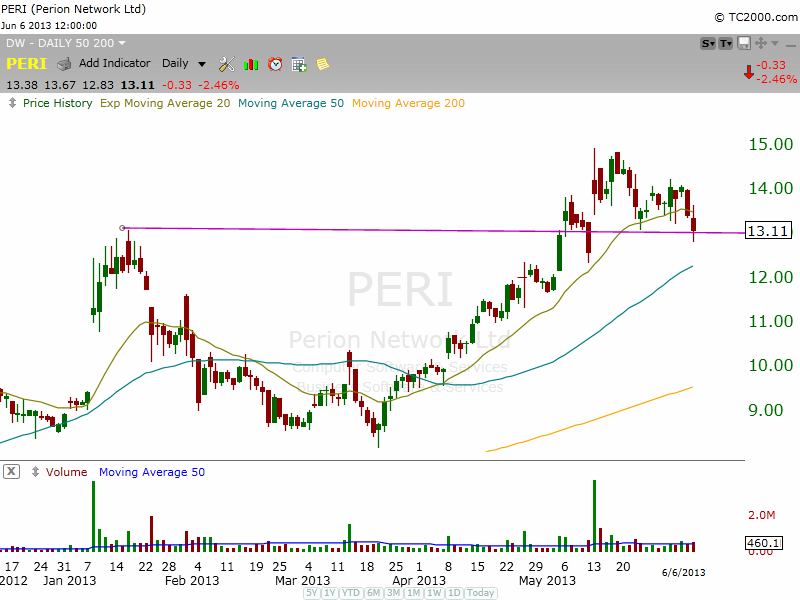
Most A rated setups need some time to develop, which makes sense because the market is in base building mode. $CPLA and $PERI are two setups on our internal watchlist that have held up nicely while the market has pulled back in.
$CPLA is a very tight consolidation at the highs of the last move. With only 13 days in the base, we’d like to see 3 to 5 more days of consolidation.

The recent breakout in $PERI stalled in mid-May. The current three week consolidation at the highs looks to be forming a “base on base” pattern. This pattern occurs when the price action on a breakout stalls and forms another 5-week base on top of (or at the highs of) the prior base. $PERI also needs another week or two of consolidation above the rising 50-day MA to produce a low risk entry point.
